Sunday, February 20, 2011

100 Sim Results - Batter Conistency (Great Stuff!)

Today, I am very pleased to announce a new file that promises to be of considerable value for the upcoming draft. It took a few days of trial and error before "automating" the selection process somewhat, preventing me from having to comb through 20,000+ lines of results one by one.

This attached file has three records for every player in the sim study: Their best and worst seasons along with a 100 sim average line. For example, 2008 Albert Pujols. The first line is his best season, the second one his 100 sim average, and the third his worst season:


Pujols turned in a wide range of results. At the top of his game he would be a Top-15 batter with a high average, and well above on-base percentage and slugging. At is worst, he hit like a middle infielder. Notice however, the consistency with hitting home runs.

Or how about Eddie Collins:

Could you imagine lucking into that .243 year? A true draft killer. Now is a good time to remind everyone about ATB Value as well. You'll notice despite weaker raw offensive statistics, Collins creams Pujols in ATB Value. This is because a) he plays at a weaker offensive position (compared to Pujols, his a much better than average shortstop than Pujols is over first basement), and b) he's a better defender as well.

The player with the largest disparity between his best and worst seasons is 1971 Hank Aaron. In the 101st sim, Aaron was among the best batters in the game slamming 50 HR's and driving in 132 runners. In the 81st sim, Aaron batted .197 with a measly 18 HRs.


1952 Jackie Robinson had the smallest difference between best and worst ATB Value scores, yet it was still considerable.


The above examples do not speak to consistency though. A batter can turn in one great, one poor, and a whole bunch of mediocre seasons and skew the results. The most consistent player in the game is 1995 Edgar Martinez:


As you can see, the majority of his results were between .230 and .240. Contrast this with the least consistent batter, 1998 Mark McGwire.


The first basemen is all over the map, and when organizing the grouping into buckets of ATB Values to the nearest two tenths (.200, .210, .220) he recorded 8 different buckets with 5 ore more results. This is 60% more than Edgar Martinez.

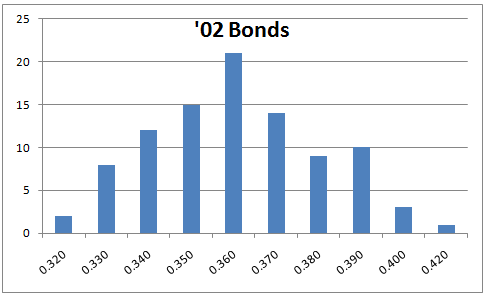
And finally, these same charts for our two greats - 2002 Barry Bonds and 1920 Babe Ruth:


I hope it is clear that Ruth is the better player. Both left fielders have similar ceilings, but Ruth is consistently performing at a higher level year in and year out, and has a lower floor to boot.

Friday, February 18, 2011

100 Sim Results - #1 Starting Pitchers

These are the results of 100 baseline resims (ended up being 95 seasons due to a silly mistake on my part, though I will continue to call it the 100 sim baseline). Each season was run in neutral parks. Injuries were turned on, each team had a strict 5 man rotation, and the schedule was set for 154 games. To date, we've completed the reviews for all of the batters, here is the link to the review section of the blog and another for the full detail for each position.

And finally what we’ve all been waiting for – the #1 starters in the game. 2000 Pedro Martinez is on par with Barry Bonds and Babe Ruth, perhaps a rung above them since he stands alone at his position. His ERA was 2.53, over ½ a run better Lady Baldwin’s. His WHIP was 0.99, no other starter had a score below 1.18 let alone in the 1.0’s. He also struck out 215 against just 47 walks.

1995 Greg Maddux is the second best of the pre-draft ace’s, and somewhat shockingly, a very slight peg below Lady Baldwin. Comparing the two:

Baldwin – 3.08 ERA, 1.18 WHIP, 189 IP, 25 BB, 230 K
Maddux -– 3.11 ERA, 1.20 WHIP, 196 IP, 40 BB, 115 K

Baldwin had a slightly better infield and a slightly better throwing catcher behind him, but even if the WHIP and ERA are a virtual tie, he gets the nod for his incredible 10.9 K/9. Maddux’s is only 5.3.

Other notables include 1913 Walter Johnson, 2004 Randy Johnson, 1996 Kevin Brown, and 1915 Petey Alexander.

The final Top 20 Starting Pitchers, regardless of draft position:

01) 210 IP, 2.53 ERA, 0.99 WHIP-Pedro Martinez-2000
02) 189 IP, 3.08 ERA, 1.18 WHIP-Lady Baldwin-1885

03) 196 IP, 3.11 ERA, 1.20 WHIP-Greg Maddux-1995

04) 189 IP, 3.40 ERA, 1.23 WHIP-Pete Conway-1888

05) 188 IP, 3.52 ERA, 1.27 WHIP-Ben Sanders-1888

06) 186 IP, 3.53 ERA, 1.21 WHIP-Walter Johnson-1913

07) 180 IP, 3.52 ERA, 1.33 WHIP-Cannonball Titcomb-1888

08) 175 IP, 3.71 ERA, 1.31 WHIP-Scott Stratton-1890

09) 182 IP, 3.52 ERA, 1.33 WHIP-Randy Johnson-2004

10) 182 IP, 3.54 ERA, 1.23 WHIP-Al Orth-1901

11) 179 IP, 3.64 ERA, 1.25 WHIP-Babe Adams-1919

12) 189 IP, 3.73 ERA, 1.24 WHIP-Addie Joss-1908

13) 187 IP, 3.58 ERA, 1.28 WHIP-Garland Braxton-1928

14) 190 IP, 3.62 ERA, 1.24 WHIP-Bill Bernhard-1902

15) 174 IP, 3.89 ERA, 1.26 WHIP-Jesse Tannehill-1902

16) 182 IP, 3.77 ERA, 1.31 WHIP-Russ Ford-1910

17) 180 IP, 3.76 ERA, 1.33 WHIP-Dizzy Dean-1934

18) 174 IP, 3.80 ERA, 1.28 WHIP-Tex Hughson-1946

19) 178 IP, 3.87 ERA, 1.34 WHIP-Kevin Brown-1996

20) 185 IP, 3.93 ERA, 1.38 WHIP-Pete Alexander-1915

Thursday, February 17, 2011

100 Sim Results - #2 Starting Pitchers

These are the results of 100 baseline resims (ended up being 95 seasons due to a silly mistake on my part, though I will continue to call it the 100 sim baseline). Each season was run in neutral parks. Injuries were turned on, each team had a strict 5 man rotation, and the schedule was set for 154 games. To date, we've completed the reviews for all of the batters, here is the link to the review section of the blog and another for the full detail for each position.

Our number two starters are unfortunately in a similar vein as our #3. Together, they averaged a 4.29 ERA, worse thatn the 5's and 4's, and on par with the 3's. It isn't all bad though, amongst the pitchers we've reviewed 1908 Addie Joss ranks 8th. He averaged a 3.73 ERA and 1.24 WHIP in 29 starts per year.

Behind Joss is 1946 Hal Newhouser (3.96, 1.48) and 1942 Mort Cooper (3.93, 1.34). It is also official - 3-Finger Brown was not meant for ATB. He recorded a 4.66 ERA and 1.51 WHIP.

Finally, I must admit I am very disappointed. I wonder how many good pitchers I missed because they weren't on my draft board. Obviously, outside the elite, my formula was flawed.

01) 189 IP, 3.73 ERA, 1.24 WHIP-Addie Joss-1908
02) 176 IP, 3.96 ERA, 1.48 WHIP-Hal Newhouser-1946

03) 180 IP, 3.93 ERA, 1.34 WHIP-Mort Cooper-1942

04) 184 IP, 4.11 ERA, 1.33 WHIP-Juan Marichal-1966

05) 179 IP, 3.87 ERA, 1.4 WHIP-Monty Stratton-1937

06) 171 IP, 4.07 ERA, 1.42 WHIP-Jason Schmidt-2003

07) 170 IP, 4.28 ERA, 1.4 WHIP-Ed Walsh-1910

08) 177 IP, 4.08 ERA, 1.4 WHIP-Bret Saberhagen-1989

09) 179 IP, 4.16 ERA, 1.43 WHIP-Dazzy Vance-1924

10) 168 IP, 4.44 ERA, 1.47 WHIP-Rube Waddell-1902

11) 168 IP, 4.85 ERA, 1.53 WHIP-Tom Seaver-1971

12) 166 IP, 4.66 ERA, 1.51 WHIP-Mordecai Brown-1906

13) 171 IP, 4.47 ERA, 1.53 WHIP-Luis Tiant-1968

14) 173 IP, 4.31 ERA, 1.43 WHIP-Silver King-1888

15) 159 IP, 4.81 ERA, 1.56 WHIP-Satchel Paige-1931

100 Sim Results - #3 Starting Pitchers

These are the results of 100 baseline resims (ended up being 95 seasons due to a silly mistake on my part, though I will continue to call it the 100 sim baseline). Each season was run in neutral parks. Injuries were turned on, each team had a strict 5 man rotation, and the schedule was set for 154 games. To date, we've completed the reviews for all of the batters, here is the link to the review section of the blog and another for the full detail for each position.

I am not going to spend much time on the #3’s. Obviously, my formula is terrible. Let’s recap. Pitchers too low on my draft board have averaged a 3.79 ERA. My #4 starters a 4.14 ERA, and now my #3 starters a 4.32.

The best of the 3’s is one of 1948 Harry Brecheen, 1999 Kevin Milwood, or 2009 Zack Greinke.

01) 177 IP, 4.13 ERA, 1.41 WHIP-Harry Brecheen-1948
02) 174 IP, 3.98 ERA, 1.36 WHIP-Kevin Millwood-1999

03) 179 IP, 3.92 ERA, 1.46 WHIP-Zack Greinke-2009

04) 169 IP, 4.16 ERA, 1.57 WHIP-Charlie Sweeney-1884

05) 174 IP, 4.04 ERA, 1.39 WHIP-John Tudor-1985

06) 179 IP, 4.15 ERA, 1.39 WHIP-Curt Schilling-2002

07) 166 IP, 4.43 ERA, 1.46 WHIP-Mike Scott-1986

08) 172 IP, 4.36 ERA, 1.46 WHIP-Ben Sheets-2004

09) 178 IP, 4.13 ERA, 1.42 WHIP-Ed Reulbach-1905

10) 167 IP, 4.36 ERA, 1.54 WHIP-Vida Blue-1971

11) 170 IP, 4.40 ERA, 1.44 WHIP-Spud Chandler-1943

12) 166 IP, 4.40 ERA, 1.56 WHIP-Lefty Gomez-1937

13) 161 IP, 4.79 ERA, 1.64 WHIP-Rich Harden-2008

14) 164 IP, 4.85 ERA, 1.55 WHIP-Charley Radbourn-1884

15) 161 IP, 4.71 ERA, 1.53 WHIP-Carl Hubbell-1933


The best at each position
S3 - 177 IP, 4.13 ERA, 1.41 WHIP-Harry Brecheen-1948
S4 - 187 IP, 3.58 ERA, 1.28 WHIP-Garland Braxton-1928
S5 - 189 IP, 3.08 ERA, 1.18 WHIP-Lady Baldwin-1885
LR - 44 IP,, 3.79 ERA, 1.36 WHIP-Fergie Jenkins-1970
SU - 153 IP, 2.67 ERA, 0.99 WHIP-Joe Neale-1890
CL - 72 IP,, 2.37 ERA, 1.18 WHIP-Jonathan Papelbon-2006

100 Sim Results - #4 Starting Pitchers

These are the results of 100 baseline resims (ended up being 95 seasons due to a silly mistake on my part, though I will continue to call it the 100 sim baseline). Each season was run in neutral parks. Injuries were turned on, each team had a strict 5 man rotation, and the schedule was set for 154 games. To date, we've completed the reviews for all of the batters, here is the link to the review section of the blog and another for the full detail for each position.

After reviewing the #5 starters earlier, today’s results for #4 starters will undoubtedly be a let down – they simply aren’t as skilled as the #5’s. (You may recall the #5’s where chosen manually by me instead of by rote formula).

The best of the 4’s was either 1928 Garland Braxton or 1902 Bill Bernhard. Braxton had the better ERA and the luxury of three “Ex” outfielders behind him while Bernhard had the better WHIP and a better infield defense. Either way, one can expect about a 3.60 ERA and 1.26 WHIP.

1910 Russ Ford and 2002 Derek Lowe make up the next tier of starter, with ERA’s around 3.75 and WHIPs in the low to mid-1.30s. Careful though, both these pitchers had a multitude of ‘Ex’ defenders in both the infield and outfield to aide in their statistical lines.

There were no surprises in the balance of the 4th starters. 1939 Ted Lyons, 1912 Joe Wood, 2009 Chris Carpenter, 1994 David Cone, 1952 Warrant Hacker, 1923 Dolf Luque, 1898 Kid Nichols, and 1964 Joel Horlen were all decent options.

In terms of disappointments, you never want to see pitchers with ERA’s in the 4.70s or worse, but it isn’t unexpected to see 1955 Billy Pierce, 1972 Steve Carlton, and 1917 Eddie Cicotte struggle.

01) 187 IP, 3.58 ERA, 1.28 WHIP-Garland Braxton-1928
02) 190 IP, 3.62 ERA, 1.24 WHIP-Bill Bernhard-1902

03) 182 IP, 3.77 ERA, 1.31 WHIP-Russ Ford-1910

04) 184 IP, 3.73 ERA, 1.36 WHIP-Derek Lowe-2002

05) 186 IP, 3.95 ERA, 1.36 WHIP-Ted Lyons-1939

06) 177 IP, 4.18 ERA, 1.38 WHIP-Joe Wood-1912

07) 170 IP, 4.14 ERA, 1.43 WHIP-Chris Carpenter-2009

08) 169 IP, 4.08 ERA, 1.4 WHIP-David Cone-1994

09) 178 IP, 4.22 ERA, 1.34 WHIP-Warren Hacker-1952

10) 172 IP, 4.21 ERA, 1.48 WHIP-Dolf Luque-1923

11) 181 IP, 4.14 ERA, 1.39 WHIP-Kid Nichols-1898

12) 172 IP, 4.16 ERA, 1.45 WHIP-Joe Horlen-1964

13) 163 IP, 4.93 ERA, 1.53 WHIP-Billy Pierce-1955

14) 166 IP, 4.69 ERA, 1.57 WHIP-Steve Carlton-1972

15) 161 IP, 4.77 ERA, 1.53 WHIP-Eddie Cicotte-1917

The best at each position:
S4 - 187 IP, 3.58 ERA, 1.28 WHIP-Garland Braxton-1928
S5 - 189 IP, 3.08 ERA, 1.18 WHIP-Lady Baldwin-1885
LR - 44 IP,, 3.79 ERA, 1.36 WHIP-Fergie Jenkins-1970
SU - 153 IP, 2.67 ERA, 0.99 WHIP-Joe Neale-1890
CL - 72 IP,, 2.37 ERA, 1.18 WHIP-Jonathan Papelbon-2006

100 Sim Results - #5 Starting Pitchers

These are the results of 100 baseline resims (ended up being 95 seasons due to a silly mistake on my part, though I will continue to call it the 100 sim baseline). Each season was run in neutral parks. Injuries were turned on, each team had a strict 5 man rotation, and the schedule was set for 154 games. To date, we've completed the reviews for all of the batters, here is the link to the review section of the blog and another for the full detail for each position.

As mentioned in the first post opening up the results for pitchers, I decided to unveil starter results in 5 phases, one for each slot in the rotation. The rotation slots were determined by my original real life rankings. However, I manually overrode many of the pitchers for the 5th slot, replacing them with key starters owners have drafted over the years. For instance, Lady Baldwin shouldn’t do well in ATB according to my rankings, and was outside of the Top 45 starters heading into the resims. I manually made him a #5 to see how he did.

Speaking of which, 1885 Lady Baldwin comes in as the best 5th starter in the simulation. In truth, Baldwin is likely the #2 or #3 overall starter, clearly behind Pedro Martinez but very close to Greg Maddux. Baldwin averaged 12 wins with a 3.08 ERA, 1.18 WHIP, 189 IP, 177 H, 45 BB, 230 K.

Behind Baldwin is, amazingly, 1888 Pete Conway, 1888 Ben Sanders, and 1888 Cannonball Titomb. Hmm, something doesn’t sit well with that does it? I double checked all the DMB input and there are no errors, but DMB sure does love 1888 for pitchers. Anyway, the trio each had ERA’s around 3.50 with Conway leading in WHIP and Titcomb in strikeouts.

Seven others had ERA’s under 4.00 and of the Top 11, only two came from 1920 or later. This is not to say players from future generations did worse, rather, it depicts how the 1800s and early 1900s players do not show up on our draft boards as great pitchers. I am sure there are at least a dozen other viable starters from this time period we just haven’t encountered yet.

As an aside, interestingly, the ERA’s we’ve seen in the sim averages are much better than the ERA’s we encounter in our actual ATB seasons. As far as I can tell, this is entirely due to my methodology of making defense a key factor in the draft rankings. In my draft, I sacrificed offense for some defense, and the result has been weaker batting and better pitching almost across the entire board.

Still, another theory I can’t corroborate without a lot of additional work is that a 15 team league is not as pitching diluted as a 20+ team league. I would suspect the more players we add to a league, the pitchers decline is skill at the same rate as the batters and it would even out in the end, but maybe not.

Either way, I am confident in the rankings of each pitcher, if not the actual resulting ERA’s – those may not translate to ATB XIII.


01) 189 IP, 3.08 ERA, 1.18 WHIP-Lady Baldwin-1885
02) 189 IP, 3.40 ERA, 1.23 WHIP-Pete Conway-1888

03) 188 IP, 3.52 ERA, 1.27 WHIP-Ben Sanders-1888

04) 180 IP, 3.52 ERA, 1.33 WHIP-Cannonball Titcomb-1888

05) 175 IP, 3.71 ERA, 1.31 WHIP-Scott Stratton-1890

06) 182 IP, 3.54 ERA, 1.23 WHIP-Al Orth-1901

07) 179 IP, 3.64 ERA, 1.25 WHIP-Babe Adams-1919

08) 174 IP, 3.89 ERA, 1.26 WHIP-Jesse Tannehill-1902

09) 180 IP, 3.76 ERA, 1.33 WHIP-Dizzy Dean-1934

10) 174 IP, 3.80 ERA, 1.28 WHIP-Tex Hughson-1946

11) 177 IP, 3.95 ERA, 1.39 WHIP-Jack Chesbro-1904

12) 165 IP, 4.39 ERA, 1.52 WHIP-Tim Lincecum-2009

13) 165 IP, 4.15 ERA, 1.43 WHIP-Johnny Podres-1957

14) 169 IP, 4.02 ERA, 1.37 WHIP-Noodles Hahn-1904

15) 157 IP, 4.50 ERA, 1.50 WHIP-Andy Pettitte-2005


Best by Position
LR - 44 IP,, 3.79 ERA, 1.36 WHIP-Fergie Jenkins-1970
SU - 153 IP, 2.67 ERA, 0.99 WHIP-Joe Neale-1890
CL - 72 IP,, 2.37 ERA, 1.18 WHIP-Jonathan Papelbon-2006
S5 - 189 IP, 3.08 ERA, 1.18 WHIP-Lady Baldwin-1885

Wednesday, February 16, 2011

100 Sim Results - Closers

These are the results of 100 baseline resims (ended up being 95 seasons due to a silly mistake on my part, though I will continue to call it the 100 sim baseline). Each season was run in neutral parks. Injuries were turned on, each team had a strict 5 man rotation, and the schedule was set for 154 games. To date, we've completed the reviews for all of the batters, here is the link to the review section of the blog and another for the full detail for each position.

We finally arrive at a glamorous pitching position and frankly, it lives up to expectation. Of all the elite closers in the games history – Eck, Mo, Gagne, Hoffman, Wagner, Smoltz, Goose*, and more – 2006 Jonathan Papelbon simmed the best, and by a healthy margin.

*Here is another example of ATB caveat emptor -untested is Goose’s 1981 campaign which promises to be of major interest to owners on draft day. Be ware of this fact and don't relegate Goose down on your draft board!

At 2.37, Papelbon had the lowest ERA of any pitcher in the simulations and was in the Top 10 in WHIP. His defense was Vg’s across the board, which sounds impressive, but based upon the way I chose players, it was about average fielding team behind him. He gave up just 60 hits in 72 innings and struck out 56 batters.

As a matter of personal pride, I am also proud to announce that 2008 Marioano Rivera has been vindicated as a top reliever choice. Long have I thought this was his best season, but over the past few years the ATB results have not born this out. Rivera was a little more hittable than Papelbon, but his low walk rate resulted in a significantly lower WHIP. His final line: 2.64 ERA, 1.13 WHIP, 81 IP, 74 H, 17 BB, 61 K.

Nine others had ERA’s at 3.00 or better with 2006 Joe Nathan the best of them – 2.57 ERA, 1.25 WHIP.

The disappointments were a relative matter only. The worst closer was 1995 Jose Mesa who turned in a solid 4.23 ERA.


01) 72 IP,, 2.37 ERA, 1.18 WHIP-Jonathan Papelbon-2006
02) 81 IP,, 2.64 ERA, 1.13 WHIP-Mariano Rivera-2008
03) 68 IP,, 2.57 ERA, 1.25 WHIP-Joe Nathan-2006

04) 75 IP,, 2.71 ERA, 1.29 WHIP-Eric Gagne-2003

05) 79 IP,, 2.82 ERA, 1.15 WHIP-Dennis Eckersley-1990
06) 72 IP,, 2.79 ERA, 1.26 WHIP-Billy Wagner-1999
07) 75 IP,, 2.73 ERA, 1.23 WHIP-Tug McGraw-1980

08) 92 IP,, 2.75 ERA, 1.32 WHIP-Bruce Sutter-1977

09) 114 IP, 2.95 ERA, 1.17 WHIP-J.J. Putz-2007
10) 69 IP,, 3.00 ERA, 1.26 WHIP-Takashi Saito-2007

11) 76 IP,, 2.68 ERA, 1.35 WHIP-B.J. Ryan-2006

12) 93 IP,, 3.18 ERA, 1.3 WHIP-Andrew Bailey-2009

13) 50 IP,, 3.14 ERA, 1.36 WHIP-Robb Nen-2000

14) 65 IP,, 3.16 ERA, 1.31 WHIP-Armando Benitez-2004
15) 85 IP,, 3.41 ERA, 1.32 WHIP-Doug Jones-1997

16) 116 IP, 3.20 ERA, 1.37 WHIP-John Smoltz-2003

17) 47 IP,, 3.37 ERA, 1.36 WHIP-Mike Jackson-1998

18) 106 IP, 3.34 ERA, 1.36 WHIP-Tim Burke-1987

19) 68 IP,, 3.41 ERA, 1.34 WHIP-Joakim Soria-2008

20) 84 IP,, 3.76 ERA, 1.34 WHIP-Bryan Harvey-1993

21) 91 IP,, 3.73 ERA, 1.36 WHIP-Rollie Fingers-1981
22) 64 IP,, 3.77 ERA, 1.52 WHIP-Trevor Hoffman-1998
23) 106 IP, 3.93 ERA, 1.4 WHIP-Jim Brewer-1972
24) 63 IP,, 3.78 ERA, 1.59 WHIP-Ugueth Urbina-1998

25) 95 IP,, 4.23 ERA, 1.51 WHIP-Rich Gossage-1977

26) 85 IP,, 3.94 ERA, 1.52 WHIP-John Wetteland-1993
27) 88 IP,, 4.26 ERA, 1.52 WHIP-Jeff Montgomery-1989
28) 150 IP, 4.32 ERA, 1.55 WHIP-John Hiller-1973
29) 35 IP,, 4.18 ERA, 1.58 WHIP-Brad Lidge-2004
30) 68 IP,, 4.23 ERA, 1.58 WHIP-Jose Mesa-1995

Looking at the entire player pool of true relievers the top 10 looks like:

2006 Papelbon
2008 Rivera

2006 Nathan

2003 Gagne

2000 White

1990 Eckersley
1890 Neale

1999 Wagner

1980 McGraw

2007 Betancourt

Tuesday, February 15, 2011

100 Sim Results - Setup Relievers

These are the results of 100 baseline resims (ended up being 95 seasons due to a silly mistake on my part, though I will continue to call it the 100 sim baseline). Each season was run in neutral parks. Injuries were turned on, each team had a strict 5 man rotation, and the schedule was set for 154 games. To date, we've completed the reviews for all of the batters, here is the link to the review section of the blog and another for the full detail for each position.

There are several elite pitchers in the position of “Setup Men”. In fact, as mentioned yesterday, many of the 100 sim setup men are in fact closers in previous ATB seasons. Eight pitchers attained a sub-3.00 ERA and each of them has spent time as a closer in our league.

The best of them appears to be the relative newcomer, 1890 Joe Neale. Neale is one of just two pitchers in the entire set of simulations to record an average WHIP under 1.00. His final line: 6-2, 2.67 ERA, 153 IP, 106 H, 45 B, 99 K, 0.99 WHIP.

His best season was a doozy: 156 IP, 1.62 ERA, 0.82 WHIP, 108 K

2000 Gabe White, 2006 Cla Meredith, and 1999 Jeff Zimmerman had ERA’s around 2.75 with WHIPS in the 1-teens. 2007 Rafael Betancourt, , 1995 Troy Percival, and 2003 Rafael Soriano struck out more batters per inning, but traded great k-rates for a quarter point in ERA.

Overall, this group was superb. 45 pitchers combined for a 3.49 ERA and a 1.36 WHIP. The moral of the story is that there are many very good relievers available, and we haven’t even looked at the closers yet.

01) 153 IP, 2.67 ERA, 0.99 WHIP-Joe Neale-1890
03) 83 IP,, 2.73 ERA, 1.19 WHIP-Gabe White-2000

02) 127 IP, 2.97 ERA, 1.20 WHIP-Rafael Betancourt-2007

04) 63 IP,, 2.90 ERA, 1.24 WHIP-Troy Percival-1995

05) 69 IP,, 3.03 ERA, 1.30 WHIP-Rafael Soriano-2003

06) 78 IP,, 2.73 ERA, 1.17 WHIP-Cla Meredith-2006
07) 97 IP,, 2.78 ERA, 1.16 WHIP-Jeff Zimmerman-1999

08) 100 IP, 2.99 ERA, 1.26 WHIP-Steve Reed-1995

09) 82 IP,, 3.10 ERA, 1.22 WHIP-Al Grabowski-1929

10) 65 IP,, 3.33 ERA, 1.28 WHIP-Tom Henke-1991

11) 157 IP, 3.09 ERA, 1.16 WHIP-Dick Hall-1964

12) 91 IP,, 3.23 ERA, 1.14 WHIP-Jeff Gray-1991

13) 102 IP, 3.65 ERA, 1.30 WHIP-Keith Foulke-1999

14) 49 IP,, 3.53 ERA, 1.28 WHIP-Derek Lilliquist-1992

15) 116 IP, 3.62 ERA, 1.35 WHIP-Octavio Dotel-2002

16) 85 IP,, 3.22 ERA, 1.34 WHIP-Taylor Buchholz-2008

17) 98 IP,, 3.20 ERA, 1.36 WHIP-Steve Mingori-1971

18) 69 IP,, 3.37 ERA, 1.36 WHIP-Jim Poole-1993
19) 105 IP, 3.35 ERA, 1.31 WHIP-Rafael Perez-2007

20) 71 IP,, 3.28 ERA, 1.31 WHIP-Buddy Groom-2002

21) 106 IP, 3.38 ERA, 1.27 WHIP-Bill Henry-1964

22) 83 IP,, 3.40 ERA, 1.38 WHIP-Tom Gordon-2004

23) 108 IP, 3.24 ERA, 1.40 WHIP-Rob Murphy-1986

24) 94 IP,, 3.23 ERA, 1.37 WHIP-Dale Murray-1974

25) 126 IP, 3.64 ERA, 1.40 WHIP-Mark Eichhorn-1986

26) 49 IP,, 3.53 ERA, 1.46 WHIP-Grant Balfour-2008

27) 74 IP,, 3.72 ERA, 1.41 WHIP-Arthur Rhodes-2001

28) 92 IP,, 3.29 ERA, 1.47 WHIP-Chris Hammond-2002

29) 107 IP, 3.97 ERA, 1.32 WHIP-Elias Sosa-1977

30) 114 IP, 3.39 ERA, 1.39 WHIP-Rheal Cormier-2003

31) 130 IP, 3.62 ERA, 1.45 WHIP-Ted Abernathy-1967
32) 57 IP,, 3.91 ERA, 1.45 WHIP-Roberto Hernandez-1992

33) 103 IP, 3.75 ERA, 1.50 WHIP-Rob Dibble-1990

34) 62 IP,, 3.68 ERA, 1.48 WHIP-Dennys Reyes-2006

35) 81 IP,, 3.69 ERA, 1.59 WHIP-Damaso Marte-2003

36) 78 IP,, 3.75 ERA, 1.36 WHIP-Ray Narleski-1956
37) 128 IP, 3.98 ERA, 1.43 WHIP-Nick Maddox-1907
38) 82 IP,, 3.84 ERA, 1.62 WHIP-Francisco Rodriguez-2004
39) 105 IP, 3.75 ERA, 1.54 WHIP-Brendan Donnelly-2003

40) 66 IP,, 3.94 ERA, 1.55 WHIP-Joey Eischen-2002
41) 138 IP, 4.26 ERA, 1.46 WHIP-Ferdie Schupp-1916

42) 90 IP,, 4.21 ERA, 1.68 WHIP-Carlos Marmol-2007

43) 127 IP, 4.33 ERA, 1.48 WHIP-Calvin Schiraldi-1986
44) 69 IP,, 4.57 ERA, 1.50 WHIP-Terry Fox-1961

45) 96 IP,, 4.27 ERA, 1.67 WHIP-Brad Ziegler-2008


Best by Position
LR - 44 IP,, 3.79 ERA, 1.36 WHIP-Fergie Jenkins-1970
SU - 153 IP, 2.67 ERA, 0.99 WHIP-Joe Neale-1890

Sunday, February 13, 2011

100 Sim Results - Long Relievers

These are the results of 100 baseline resims (ended up being 95 seasons due to a silly mistake on my part, though I will continue to call it the 100 sim baseline). Each season was run in neutral parks. Injuries were turned on, each team had a strict 5 man rotation, and the schedule was set for 154 games. To date, we've completed the reviews for all of the batters, here is the link to the review section of the blog and another for the full detail for each position.

Reviewing 180 or so pitchers in a single blog post would get pretty boring very quickly and I thought a review "by position" would be more appropriate. Position is relative however, as ATB Owners typically pick from a player pool of elite #1 starters. Traditionally, only the ATB setup and closer roles roles utilize real life relievers, and even then lines can be blurred a la Gabe White acting in an ATB closer role.

In order to account for this, I used the manufactured draft positions as the basis for the writeup categories. The draft positions were based upon my personal high level formula, all which simply means take the "#1 Sp vs #2 Sp" categorization with a grain of salt. If I have a player in the LR role, for example, he could be used as a starter next season (assuming he meets the 20 real life start minimum qualification).

One other item before we get to the long relievers. As we all know by now, defense is a critical aspect of DMB. I deliberately chose not to normalize each fielder to an average defensive rating, but only because it is an incredible amount of work. This leaves us with the following disparity (as an example):

Assigning an average defensive score based upon Infield, Outfield, and Catcher positions (where Ex = 5, Vg = 4, Av = 3, Fr = 2, Pr = 1)

Team 6: 5.0 OF / 4.0 IF / 5.0 C
Team
4: 3.7 OF / 3.8 IF / 4.0 C

This is a large disparity and undoubtedly will cause Team 6 to have a better ERA than Team 4, all else being equal. To account for this, I adjusted the final rankings for each player accordingly. However, all displayed statistics are not adjusted.

On to the long relievers.

These players are generally real life starting pitchers coming in a cut below those ATB starters we've all grown accustomed to. However, there are a few exceptions (Bobby Shantz, Mike Mussina come to mind) were the player is routinely used as a starter.

The best of this crew looks to be 1970 Fergie Jenkins. In 95 seasons he averaged a 3.79 ERA, 1.36 WHIP, and almost a 2:1 K/BB ratio in 44 IP. The 44 IP seems extremely low as sample size concerns immediately come to mind, but please remember this is his average over 4,200 simmed innings and it's safe to assume this as Jenkins true level of talent.

Behind Jenkins is 2009 Danny Haren and 2001 Roy Oswalt, both with ERA's around 4.00 and H/9 around 10.0. 1921 Red Faber and 1993 Kevin Appier had ERA's under 4.00 too.

The biggest disappointment is likely the aforementioned 1995 Mike Mussina who had an ERA over 4.50 and a WHIP of 1.50.


The Long Relievers
01)44 IP, 3.79 ERA, 1.36 WHIP - Fergie Jenkins 1970
02)47 IP, 3.93 ERA, 1.38 WHIP - Danny Haren 2009

02)48 IP, 4.05 ERA, 1.44 WHIP - Roy Oswalt 2001

04)43 IP, 3.97 ERA, 1.40 WHIP - Red Faber 1921

05)41 IP, 3.96 ERA, 1.53 WHIP - Kevin Appier 1993

06)40 IP, 4.64 ERA, 1.53 WHIP - Juan Guzman 1996

07)49 IP, 4.41 ERA, 1.43 WHIP - Tiny Bonham 1942

08)42 IP, 4.43 ERA, 1.50 WHIP - Vean Gregg 1911

09)43 IP, 4.39 ERA, 1.47 WHIP - Justin Duchscherer 2008

10)44 IP, 4.44 ERA, 1.48 WHIP - Tommy Bond 1876

11)42 IP, 4.51 ERA, 1.50 WHIP - Mike Mussina 1995

12)47 IP, 5.08 ERA, 1.60 WHIP - Denny McLain 1968

13)39 IP, 4.92 ERA, 1.58 WHIP - Jim Palmer 1975

14)41 IP, 4.52 ERA, 1.54 WHIP - Warren Spahn 1953

15)47 IP, 5.30 ERA, 1.76 WHIP - Ewell Blackwell 1947

Friday, February 11, 2011

100 Sim Results - Batter Afterthoughts

A few random items I found interesting going through this study
  • Is DMB biased towards one era vs another? Perhaps so. Here is the compiled slash stats for certain time periods - the 1800s, the early 1900s, etc. The 1960s and 1970s especially show a remarkable downturn in batting results. Of course, this study is not conclusive, just interesting. To do it right, I would need to sim all of the players from all of the era's and not just the players I personally think are best. One thing seems clear - when in doubt, choose the batters from the Ruth era.
  • As expected, first base and left field are the power positions while catcher and middle infielders are the weakest. I was surprised to see center fielders better than right fielders, but the difference isn't all that significant.


  • I don't love the following chart, but I tried to depict the depth at each position. It is colored coded green to yellow to red based upon OPS, with blue reserved to the uber-elite. Hopefully it will be obvious that first base is very deep (lots of green) and shortstops are awful (lots of orange). The chart above reflects the average results for the entire player pool, while the one below is for just the starting players. Click on the chart for a larger view.


  • Finally, I wanted to let everyone know I didn't mean to publish all of this data today. My apologies for the overload. Blogger allows me to publish with a future date, and the post appears automatically when the expected time is reached. That didn't work today, as most of these were to be 'live' next week.

100 Sim Results - Right Field

These are the results of 100 baseline resims (ended up being 95 seasons due to a silly mistake on my part, though I will continue to call it the 100 sim baseline). Each season was run in neutral parks. Injuries were turned on, each team had a strict 5 man rotation, and the schedule was set for 154 games. To date, we've completed the reviews for designated hitters, catchers, first basemen, second basemen, third basemen, shortstops, left fielders, and center fielders. Here is a link to the full detail by position.

Outside of 1920 Babe Ruth, and to a limited extent 1948 Stan Musial, the right field pool simmed much weaker than what I think most people suspected. Ruth has been confirmed as the best player in ATB, batting .282 / .481 / .630 with 47 HR and 149 RC per season. This puts him on equal footing with Bonds in OBP (Bonds .485) but he outslugs him by over 80 points. He simply has more power – 8 more doubles, 2 more triples, and 11 more home runs. One item to note, on the downside however, Ruth strikes out more than twice as much as Bonds (142 vs 66).

Musial is the only other right fielder with an OPS over .800, batting .293 / .340 / .499 with 24 doubles, 12 triples, and 25 home runs. This is awesome, but compared to Ruth there is just no eye candy.

The third tier of players are roughly equal to each, with 1923 Harry Heilmann, 1997 Larry Walker, and 1911 Joe Jackson each with OPS scores in the low .770s. Heilmann and Jackson the same players with OBP’s in the mid .350s and slug in the .415 range. Walker offers more power (27 HR, .446 SLG) but has a fairly low OBP of .328.

Critical flaws begin to appear in the 4th tier of players. 1966 Frank Robinson, 2001 Sammy Sosa, and 1971 Hank Aaron average around 30 home runs per season but hardly get on base. 1906 Harry Lumley gets on base better than average, but hits under 10 home runs per season.


01) 0.282 / 0.481 / 0.630 - 1920 Ruth,Babe
02) 0.293 / 0.340 / 0.499 - 1948 Musial,Stan
03) 0.296 / 0.358 / 0.414 - 1923 Heilmann,Harry
04) 0.263 / 0.328 / 0.446 - 1997 Walker,Larry
05) 0.308 / 0.355 / 0.416 - 1911 Jackson,Joe

06) 0.249 / 0.317 / 0.420 - 1966 Robinson,Frank

07) 0.234 / 0.299 / 0.438 - 2001 Sosa,Sammy

08) 0.241 / 0.290 / 0.444 - 1971 Aaron,Hank
09) 0.274 / 0.331 / 0.383 - 1906 Lumley,Harry

10) 0.224 / 0.325 / 0.367 - 1996 Sheffield,Gary

11) 0.275 / 0.334 / 0.365 - 1944 Walker,Dixie

12) 0.265 / 0.316 / 0.388 - 1945 Holmes,Tommy

13) 0.301 / 0.337 / 0.345 - 1987 Gwynn,Tony

14) 0.286 / 0.342 / 0.353 - 1936 Waner,Paul

15) 0.302 / 0.336 / 0.347 - 1994 Gwynn,Tony

16) 0.280 / 0.301 / 0.368 - 1967 Clemente,Roberto

17) 0.239 / 0.312 / 0.340 - 1967 Kaline,Al

18) 0.250 / 0.323 / 0.331 - 1884 Shaffer,Orator


Recapping the #1 choices at each position
CA-’86 Kelly - -.310 / .399 / .380, 179 TB
1B-’27 Gehrig - .297 / .375 / .584, 336 TB

2B-’24 Hornsby- .301 / .373 / .444, 260 TB
3B-’80 Brett - -.304 / .351 / .454, 278 TB

SS-’35 Vaughan -.274 / .366 / .381, 226 TB

LF-’02 Bonds - -.292 / .485 / .549, 263 TB

CF-’57 Mantle - .316 / .430 / .480, 270 TB

RF-’20 Ruth - - .282 / .481 / .630, 301 TB
DH-’01 Giambi - .265 / .376 / .418, 227 TB

100 Sim Results - Designated Hitters

These are the results of 100 baseline resims (ended up being 95 seasons due to a silly mistake on my part, though I will continue to call it the 100 sim baseline). Each season was run in neutral parks. Injuries were turned on, each team had a strict 5 man rotation, and the schedule was set for 154 games. To date, we've completed the reviews for catchers, first basemen, second basemen, third basemen, shortstops, left fielders, and center fielders. Here is a link to the full detail by position.

Frankly, I made a mistake with the designated hitters. My process for assigning them was to simply take the best players not drafted in the position slots and make them DH’s. This meant legit starters such as Bobby Murcer, Reggie Jackson, and Willie Stargell were considered only in the DH spot. In hindsight, I should have reserved this position for “Fair” or worse fielding defenders.

The good news is that tor the most part, as you’ll see, these DH’s are in fact players are of the Jason Giambi and Frank Thomas ilk.

2001 Jason Giambi Is the best DH in the study. He recorded a .376 OBP while hitting 19 HR and 26 doubles on average each year. Close behind is 2002 Jim Thome who belted 35 per season, 6th best among all batters. His main issue is a low OBP (.338) largely driven from a very low batting average (.232). 1994 Frank Thomas is a similar player (.342 OBP, 27 HR) as well.

Elsewhere, 1994 Albert Belle, 1961 Jim Gentile, 1969 Reggie Jackson and 1973 Willie Stargell all had plus power averaging 32 HR’s between them. Kevin Mitchell hits 33 per season, but his .263 OBP can’t be worth it.

Edgar Martinez, circa 1995 recorded a .355 OBP with 31 doubles which looks excellent until you realize his 11 HR resulted in a “very low for a DH” slugging average of .377.

Top 15:
01) 0.265 / 0.376 / 0.418 - 2001 Giambi,Jason
02) 0.232 / 0.338 / 0.431 - 2002 Thome,Jim
03) 0.243 / 0.342 / 0.426 - 1994 Thomas,Frank
04) 0.272 / 0.326 / 0.462 - 1994 Belle,Albert
05) 0.237 / 0.328 / 0.439 - 1961 Gentile,Jim
06) 0.243 / 0.303 / 0.488 - 1973 Stargell,Willie
07) 0.270 / 0.355 / 0.377 - 1995 Martinez,Edgar
08) 0.225 / 0.313 / 0.442 - 1969 Jackson,Reggie
09) 0.279 / 0.348 / 0.389 - 1971 Murcer,Bobby
10) 0.280 / 0.331 / 0.391 - 1989 Clark,Will
11) 0.277 / 0.309 / 0.409 - 1884 Reilly,John
12) 0.250 / 0.323 / 0.381 - 1985 Guerrero,Pedro
13) 0.215 / 0.263 / 0.427 - 1989 Mitchell,Kevin
14) 0.221 / 0.330 / 0.336 - 1884 Stovey,Harry
15) 0.197 / 0.295 / 0.353 - 1951 Kiner,Ralph

Recapping the #1 choices at each position
CA-’86 Kelly - -.310 / .399 / .380, 179 TB
1B-’27 Gehrig - .297 / .375 / .584, 336 TB
2B-’24 Hornsby- .301 / .373 / .444, 260 TB
3B-’80 Brett - -.304 / .351 / .454, 278 TB
SS-’35 Vaughan -.274 / .366 / .381, 226 TB
LF-’02 Bonds - -.292 / .485 / .549, 263 TB
CF-’57 Mantle - .316 / .430 / .480, 270 TB
DH-’01 Giambi - .265 / .376 / .418, 227 TB

100 Sim Results - Center Field

These are the results of 100 baseline resims (ended up being 95 seasons due to a silly mistake on my part, though I will continue to call it the 100 sim baseline). Each season was run in neutral parks. Injuries were turned on, each team had a strict 5 man rotation, and the schedule was set for 154 games. To date, we've completed the reviews for catchers, first basemen, second basemen, third basemen, shortstops, and left fielders. Here is a link to the full detail by position.

While Left Field is home to the most elite batters in ATB, center field is the deepest position. 13 of the 15 starters had OPS scores above .700. Leading the way is 1957 Mickey Mantle. The Commerce Commet has it all. He batted .316 /. 430 / .480 with 21 home runs, 20 doubles, 5 triples, and was one of just 5 players to have a batting average over .310. He also averaged 13 stolen bases against just 4 caught stealing

1925 Oscar Charleston and 1917 Ty Cobb rank two – three before 6 players vie for 4th best. Charleston recorded more extra base hits than Mantle (50 vs 55) and bats a robust .292, but his lack of walks bring down has value considerably.

Cobb is ranked behind Charleston in my rankings, but had I seen this earlier I would have altered them. At issue is Cobb’s five home runs which are obviously extremely low. However, because of his gap power, Cobb averaged 32 dobles and and 16 triples which should make up for the lack of true raw home run power. Comparing their lines, I think it clear which is the better player

OC - .292 / .337 / .448, 22 2B, 7 3B, 21 HR, +20 SB
TC - .316 / .363 / .446, 32 2B, 16 3B, 5 HR, +19 SB

In the next tier of players, 1894 Hugh Duffy is the most balanced (.345 OBP, .421 SLG) while 1885 Pete Browing, 1915 Benny Kauff, and 1916 Tris Speaker offer high on base percentages and little power, and 1941 Joe DiMaggio and 1954 Duke Snider offer good power but league average OBP’s.

A note on Speaker. His .382 slugging average is a definite dissappointment, but it may be the year chosen. For this exercise I chose 1916 (185 OPS+) but many owners prefer 1912 (188 OPS+). Keep this in mind on draft day.

Their resim rankings:

01) 0.316 / 0.430 / 0.480 - 1957 Mantle,Mickey
02) 0.292 / 0.337 / 0.448 - 1925 Charleston,Oscar
03) 0.316 / 0.363 / 0.446 - 1917 Cobb,Ty
04) 0.299 / 0.345 / 0.421 - 1894 Duffy,Hugh
05) 0.266 / 0.378 / 0.363 - 1885 Browning,Pete
06) 0.277 / 0.362 / 0.385 - 1915 Kauff,Benny
07) 0.318 / 0.385 / 0.382 - 1916 Speaker,Tris
08) 0.273 / 0.327 / 0.427 - 1941 DiMaggio,Joe
09) 0.267 / 0.324 / 0.424 - 1954 Snider,Duke
10) 0.284 / 0.329 / 0.399 - 1905 Seymour,Cy
11) 0.239 / 0.333 / 0.425 - 2004 Edmonds,Jim
12) 0.239 / 0.302 / 0.416 - 1993 Griffey Jr.,Ken
13) 0.244 / 0.294 / 0.427 - 1965 Mays,Willie
14) 0.283 / 0.372 / 0.317 - 1898 Hamilton,Billy
15) 0.269 / 0.313 / 0.388 - 1941 Reiser,Pete
16) 0.183 / 0.300 / 0.287 - 1969 Wynn,Jim

Recapping the #1 choices at each position
CA-’86 Kelly - -.310 / .399 / .380, 179 TB
1B-’27 Gehrig - .297 / .375 / .584, 336 TB
2B-’24 Hornsby- .301 / .373 / .444, 260 TB
3B-’80 Brett - -.304 / .351 / .454, 278 TB
SS-’35 Vaughan -.274 / .366 / .381, 226 TB
LF-’02 Bonds - -.292 / .485 / .549, 263 TB
CF-’57 Mantle - .316 / .430 / .480, 270 TB

100 Sim Results - Left Field

These are the results of 100 baseline resims (ended up being 95 seasons due to a silly mistake on my part, though I will continue to call it the 100 sim baseline). Each season was run in neutral parks. Injuries were turned on, each team had a strict 5 man rotation, and the schedule was set for 154 games. To date, we've completed the reviews for catchers, first basemen, second basemen, third basemen, and shortstops. Here is a link to the full detail by position.

Left field is the premier offensive position in ATB. 6 players averaged an OPS of .850 or better over the course of the 100 resims, and thre of them where from left fielders. No other position has multiple players of this caliber.

Leading the way is 2002 Barry Bonds, an absolute monster. He averaged a slash line of .292 / .485 / .549 with an OPS of 1.034, 36 HR, 112 R, 110 RBI, and 14 SB. That’s his average mind you! His ceiling was off the charts, a .321 / .516 / .705 showing with 49 HR.

At a distant second to Bonds, but still Top-3 overall in the game, is 1941 Ted Williams. Williams hits about 35 points better than Bonds, and has a similar number of extra base hits, but doesn’t walk nearly as much. This isn’t a knock, his OBP is 4th best in the game, but does illustrate what additional value Bonds brings to a team.

1887 Tip O’Neil finishes a clear cut third thanks to a .322 / .381 / .476 line. He is an extra base hit machine belting an average of 39 doubles, 11 triples, and 11 home runs per season. He has some speed as well, stealing about 24 bases each simulation.

After the big 3 comes a serious drop off in talent. 1990 Rickey Henderson, 1899 Ed Delahanty, 1906 George Stone, 1928 Goose Goslin, and 1967 Carl Yastrzemski each clocked in with OPS scores between .737 and and .751. Delahanty and Stone provide the best on base skills (about .350) while Yaz has the most power with an average of 25 home runs per season. 1901 Jesse Burkett also deserves mentione due to his .360 OBP, but his power (.355 SLG) makes him a clear tier below.


Their Rankings:

01) 0.292 / 0.485 / 0.549 - 2002 Bonds,Barry
02) 0.326 / 0.435 / 0.523 - 1941 Williams,Ted
03) 0.322 / 0.381 / 0.476 - 1887 O'Neill,Tip

04) 0.258 / 0.342 / 0.397 - 1990 Henderson,Rickey

05) 0.308 / 0.349 / 0.402 - 1899 Delahanty,Ed

06) 0.299 / 0.350 / 0.392 - 1906 Stone,George

07) 0.282 / 0.333 / 0.411 - 1928 Goslin,Goose
08) 0.256 / 0.326 / 0.411 - 1967 Yastrzemski,Carl
09) 0.297 / 0.360 / 0.355 - 1901 Burkett,Jesse

10) 0.233 / 0.306 / 0.409 - 2001 Gonzalez,Luis

11) 0.282 / 0.348 / 0.351 - 1897 Clarke,Fred

12) 0.271 / 0.296 / 0.419 - 1937 Medwick,Joe
13) 0.283 / 0.324 / 0.362 - 1924 Wheat,Zack


Recapping the #1 choices at each position
CA-’86 Kelly - -.310 / .399 / .380, 179 TB
1B-’27 Gehrig - .297 / .375 / .584, 336 TB

2B-’24 Hornsby- .301 / .373 / .444, 260 TB

3B-’80 Brett - -.304 / .351 / .454, 278 TB
SS-’35 Vaughan -.274 / .366 / .381, 226 TB
LF-’02 Bonds - -.292 / .485 / .549, 263 T
B

Thursday, February 10, 2011

100 Sim Season Results - Shortstop

These are the results of 100 baseline resims (ended up being 95 seasons due to a silly mistake on my part, though I will continue to call it the 100 sim baseline). Each season was run in neutral parks. Injuries were turned on, each team had a strict 5 man rotation, and the schedule was set for 154 games. To date, we've completed the reviews for catchers, first basemen, second basemen, and third basemen. Here is a link to the full detail by position.

At shortstop, 1935 Arky Vaughan and 1908 Honus Wagner come in ranked as 1 and 1A. Vaughan, the standard pick for first shortstop taken offers great balance - .274 / .366 / .381 with 14 HR and a .747 OPS. Wagner, while hitting few home runs, offers significant improvements in overall gap power (51 EBH vs 35) but this is at a cost of OBP. His slash line is .293 / .337 / .418 with a .755 OPS. Wagner also steals 35 bases per season while Vaughan attempts less than 5 pe year. Either is a fine choice for the first shortstop taken off the board, and an acceptable first rounder.

Pickings quickly become slim after this elite 1-2 combination. No other shortstop averaged a .700 OPS though there is defintely some value to be found.

Negro leaguer Pop Lloyd (1910) averaged a .351 OBP with 19 doubles and 35 stolen bases
1948 Lou Boudreau batted .276 with a .335 OBP and 177 total bases
1896 Hughie Jennings can still take a pitch on the shoulder, averaging 55 HBP per year and a .374 OBP.
The premier power hitter, 1969 Rico Petrocelli, hit 17 HR per year but batted just .215 with a .287 OBP.

The Top 15…

01) 0.274 / 0.366 / 0.381 - 1935 Vaughan,Arky
02) 0.293 / 0.337 / 0.418 - 1908 Wagner,Honus
03) 0.275 / 0.351 / 0.348 - 1910 Lloyd,Pop
04) 0.276 / 0.335 / 0.353 - 1948 Boudreau,Lou
05) 0.296 / 0.374 / 0.317 - 1896 Jennings,Hughie
06) 0.253 / 0.295 / 0.374 - 1982 Yount,Robin
07) 0.253 / 0.338 / 0.308 - 1923 Sewell,Joe
08) 0.215 / 0.287 / 0.358 - 1969 Petrocelli,Rico
09) 0.276 / 0.336 / 0.292 - 1936 Appling,Luke
10) 0.261 / 0.294 / 0.337 - 2000 Garciaparra,Nomar
11) 0.232 / 0.294 / 0.332 - 1896 Dahlen,Bill
12) 0.201 / 0.282 / 0.302 - 1996 Larkin,Barry
13) 0.262 / 0.323 / 0.284 - 1943 Appling,Luke
14) 0.261 / 0.302 / 0.297 - 1886 Glasscock,Jack
15) 0.245 / 0.312 / 0.262 - 1926 Bancroft,Dave

Recapping the #1 choices at each position
CA-’86 Kelly - -.310 / .399 / .380, 179 TB
1B-’27 Gehrig - .297 / .375 / .584, 336 TB
2B-’24 Hornsby- .301 / .373 / .444, 260 TB
3B-’80 Brett - -.304 / .351 / .454, 278 TB
SS-’35 Vaughan -.274 / .366 / .381, 226 TB

Wednesday, February 9, 2011

100 Sim Season Results - Third Base

These are the results of 100 baseline resims (ended up being 95 seasons due to a silly mistake on my part, though I will continue to call it the 100 sim baseline). Each season was run in neutral parks. Injuries were turned on, each team had a strict 5 man rotation, and the schedule was set for 154 games. To date, we've completed the reviews for catchers, first basemen, and second basemen. Here is a link to the full detail by position.

I guess 1980 George Brett is a better choice than 1899 John McGraw, but by no means am I convinced of it. Brett is an all around hitter - he bats for average (.304), power (.454 SLG) and has decent speed (18 SB). He also has the second highest on base percentage among third basemen at .351. You can't go wrong right?

True, but maybe you could do better. Would you rather what Brett brings or an astounding .449 OBP, third best among all positions? It's not cut and dry by any means. John McGraw is an OBP machine, averaged 126 walks a season. He also is extremely fast, stealing successfully about 76 times each year, topping out at 105 in Sim #1. (Of interest, McGraw had the top 42 seasons for stolen bases in the 95 resims).

Elsewhere, 1953 Al Rosen is George Brett light (.270 / .325 / .424), 1954 Eddie Mathews provides some pop (32 HR's), and 2008 Chipper Jones has a well above average OBP (.365).


Before moving to the Top 15 list, a note on Mike Schmidt. I am slightly apalled that DMB game engine pours so much hate on the Schmidt, arguably the best 3rd basemen in the post war era. At the time of this writing there are 6 different Schmidt seasons in the database. In past ATB seasons, he's sucked in every single one of them. A large part of me loosened the playing time restrictions going forward just to see how the famous 1981 Mike Schmidt would fair. My money is still on a stinker.

01) 0.304 / 0.351 / 0.454 - 1980 Brett,George
02) 0.310 / 0.449 / 0.330 - 1899 McGraw,John
03) 0.270 / 0.325 / 0.424 - 1953 Rosen,Al
04) 0.223 / 0.317 / 0.426 - 1954 Mathews,Eddie
05) 0.284 / 0.365 / 0.345 - 2008 Jones,Chipper
06) 0.239 / 0.293 / 0.420 - 1966 Allen,Dick
07) 0.274 / 0.329 / 0.362 - 1913 Baker,Frank
08) 0.280 / 0.311 / 0.361 - 1971 Torre,Joe
09) 0.255 / 0.289 / 0.384 - 2004 Beltre,Adrian
10) 0.281 / 0.364 / 0.309 - 1988 Boggs,Wade
11) 0.227 / 0.300 / 0.349 - 2004 Rolen,Scott
12) 0.209 / 0.295 / 0.353 - 1982 Schmidt,Mike
13) 0.228 / 0.305 / 0.308 - 1966 Santo,Ron
14) 0.237 / 0.338 / 0.271 - 1884 Sutton,Ezra
15) 0.228 / 0.265 / 0.295 - 1964 Robinson,Brooks

Recapping the #1 choices at each position
CA-’86 Kelly - -.310 / .399 / .380, 179 TB
1B-’27 Gehrig - .297 / .375 / .584, 336 TB
2B-’24 Hornsby- .301 / .373 / .444, 260 TB
3B-’80 Brett - -.304 / .351 / .454, 278 TB


Tuesday, February 8, 2011

100 Sim Season Results - Second Base

These are the results of 100 baseline resims (ended up being 95 seasons due to a silly mistake on my part, though I will continue to call it the 100 sim baseline). Each season was run in neutral parks. Injuries were turned on, each team had a strict 5 man rotation, and the schedule was set for 154 games. To date, we've completed the reviews for catchers and first basemen. Here is a link to the full detail by position.

Like we saw at first base, there is one player that is leaps and bounds above the field at second base. 1924 Rogers Hornsby leads all second baggers in batting average, on base percentage, slugging percentage, OPS, TOPS, Total Bases, and Runs Created. He averaged 46 extra base hits, 16 of them home runs. He is the best pure hitting second basemen in ATB, only hampered by his lack of speed (6 stolen bases).

Behind Rajah is 1976 Joe Morgan and 1884 Fred Dunlap. Morgan walks and hits for more power, but Dunlap's contact rates gives him a 40 point edge in batting average and a less drastic 16 point edge in slugging. They both have a .348 OBP so lets call it an owner preference - choose what you want - power and speed or better rate stats.

Coming in at three and four are, and I hate to say it, a disappointing Eddie Collins and Nap Lajoie. Collins at least gives you Ex defense and has a great .365 OBP, but Lajoie's .324 OBP may come as a shock to many. Lajoie still hit 37 doubles and is ranked third in total bases, but I had higher hopes for Nap.

A word of caution too. These compilations represent the pure average of the player of the course of 95 seasons. This is an incredible volume, and DMB automatically introduces random variability into their simulation. Case in point, take a look at these two stat lines:

.336 / .403 / .432, 24 2B, 12 3B, 93 RC
.249 / .318 / .298, 10 2B, 07 3B, 58 RC

If you haven't guessed, these are two lines for Eddie Collins, the first one from Sim #19 and the second from Sim #59.


Finally, we need to mention 1952 Jackie Robinson. A vogue mid round pick, Robinson performed poorly in these sims. His slash line of .239 / .324 / .271 is awful - he had just 9 extra base hits. I mention this specifically because my rankings have '52 as his best year, and the DC Chips had a lot of success with his '51 season in ATB XII. This is another reminder to treat these baselines as part of the puzzle, and not a definitive view on player performance.

01) 0.301 / 0.373 / 0.444 - 1924 Hornsby,Rogers
02) 0.282 / 0.348 / 0.400 - 1884 Dunlap,Fred
03) 0.242 / 0.348 / 0.384 - 1976 Morgan,Joe
04) 0.293 / 0.365 / 0.346 - 1914 Collins,Eddie
05) 0.291 / 0.324 / 0.394 - 1904 Lajoie,Nap
06) 0.260 / 0.332 / 0.323 - 1934 Gehringer,Charlie
07) 0.273 / 0.317 / 0.342 - 1886 Richardson,Hardy
08) 0.249 / 0.325 / 0.318 - 1890 Childs,Cupid
09) 0.252 / 0.328 / 0.304 - 2001 Alomar,Roberto
10) 0.237 / 0.301 / 0.328 - 2000 Kent,Jeff
11) 0.254 / 0.338 / 0.284 - 1908 Evers,Johnny
12) 0.255 / 0.309 / 0.321 - 1942 Gordon,Joe
13) 0.239 / 0.324 / 0.271 - 1952 Robinson,Jackie
14) 0.239 / 0.338 / 0.256 - 1950 Stanky,Eddie
15) 0.220 / 0.275 / 0.315 - 1944 Doerr,Bobby


Monday, February 7, 2011

100 Sim Season Results - First Base

These are the results of 100 baseline resims (ended up being 95 seasons due to a silly mistake on my part, though I will continue to call it the 100 sim baseline). Each season was run in neutral parks. Injuries were turned on, each team had a strict 5 man rotation, and the schedule was set for 154 games. To date, we've completed the catcher review. Here is a link to the full detail by position.

At first base, and at no surprise, Lou Gehrig stands out as one of the truly elite batters in ATB. In the re-sims he averaged 37 HR and 34 doubles while maintaining a stellar slash line of .297 / .375 / .584 with a .959 OPS. His OPS is 120 points better than the next best first basemen, and he's one of only four players in the entire game to average an OPS of .850 or better.

Behind Gehrig are 5 very good options, each with OPS scores over .800. Somewhat surprisingly, this list does not include 1969 Willie McCovey or 2008 Albert Pujols. Even more shocking, is that 1961 Norm Cash heads the list among tier 2 players. His slash line averaged .297 / .388 / .451.

1932 Jimmie Foxx and 1998 Mark McGwire are low OBP high power options, belting 39 and 43 respectively. Dan Brouthers is a cheap option and underrated - .302 / .376 / .435 with 24 stolen bases.
The top 15 work out in the following manner:

01) 0.297 / 0.375 / 0.584 - 1927 Gehrig,Lou
02) 0.297 / 0.388 / 0.451 - 1961 Cash,Norm
03) 0.256 / 0.340 / 0.475 - 1932 Foxx,Jimmie
04) 0.206 / 0.341 / 0.462 - 1998 McGwire,Mark
05) 0.302 / 0.376 / 0.435 - 1886 Brouthers,Dan
06) 0.276 / 0.327 / 0.488 - 1994 Bagwell,Jeff
07) 0.256 / 0.327 / 0.460 - 1969 McCovey,Willie
08) 0.269 / 0.344 / 0.409 - 2008 Pujols,Albert
09) 0.303 / 0.352 / 0.395 - 1938 Leonard,Buck
10) 0.282 / 0.354 / 0.380 - 1993 Olerud,John
11) 0.269 / 0.328 / 0.417 - 1932 Terry,Bill
12) 0.286 / 0.324 / 0.400 - 1920 Sisler,George
13) 0.299 / 0.346 / 0.360 - 1974 Carew,Rod
14) 0.299 / 0.344 / 0.366 - 1977 Carew,Rod
15) 0.245 / 0.309 / 0.367 - 1885 Orr,Dave