Wednesday, April 30, 2014
Tuesday, April 29, 2014
The Chips are Sliding and the Fishbiscuits Are Taking Advantage
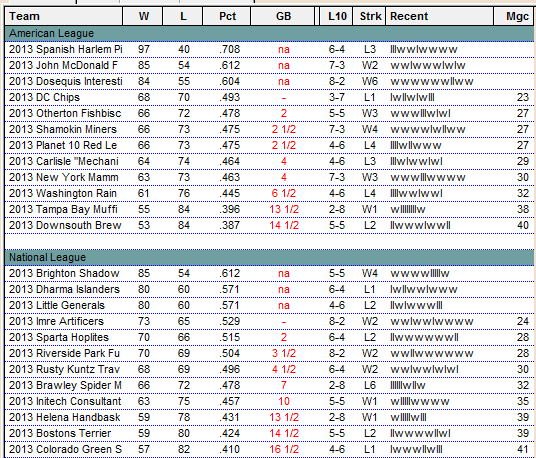
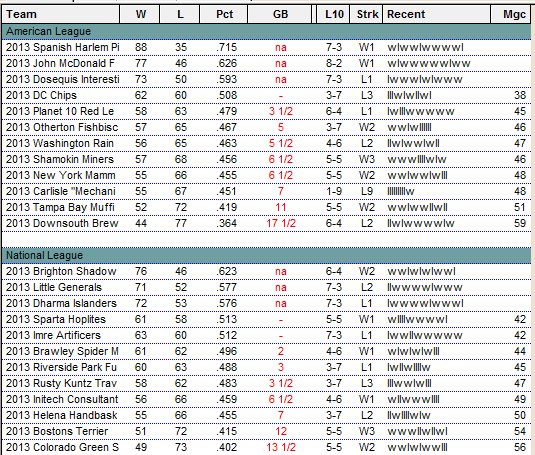
Earlier this evening the Otherton Fishbiscuits caught and then passed the DC Chips for the American League Wild Card lead. This completes a slide that began in early June, but picked up in earnest in mid August. While DC has lost 17 of their last 25, Otherton has won 15 of 26, and now own a half game lead in for the Wild Card.
Through August 14 (119 games) the Chips had scored 4.3 runs per game and yielded 4.0, good enough for a +35 run differential. Since August 15 (25 games) those values have dipped to 3.5 and 4.8 respectively, poor enough for a -32 run differential.
Their starting pitching is mostly to blame:
12.27 ERA - Bert Blyleven (1 GS)
10.67 ERA - Wall Bunker (3 GS)
5.94 ERA - Dutch Leonard (7 GS)
5.75 ERA - Art Ditmar (4 GS)
4.40 ERA - George Zettelin (6 GS)
Ty Cobb (.220 / .288 / .320) and Mel Ott (.216 / .296 / .318) have also chosen inopportune times to slump.
For their part, Otherton has turned their season around in the opposite way. Over the same time frames, their Run Scoring has increased from 4.1 r/g to 4.8 r/g, while their run prevention has improved from 4.3 r/g to 3.5 r/g.
Their stars:
1.49 ERA - Amos Rusie (6 GS)
2.61 ERA - Warren Hacker (10 IP)
3.24 ERA - Bill Bernhard (7 GS)
3.57 ERA - Grant Jackson (17 IP)
No regular has an ERA over 4.00 and George Stone batted .400 / .455 / .500*
*This should probably be another blog post entirely, but has any trade ever worked out better for two teams in the history of ATB? On August 17 Otherton and Imre swapped 6 players. Since then, Otherton has a 14-8 record and took the wild card lead. Imre has a 13-7 record and also took the wild card lead. Here is how the 6 are faring:
Imre
- Kevin Brown (3-0, 1.80 ERA, 25 IP, 19 H)
- Hong Chi Kuo (1-1, 2 Sv, 1 bad outing)
- George Gore (2 H, 4 AB)
Otherton
- Warren Hacker (2.61 ERA, 10 IP in relief)
- George Stone ( .400 / .455 / .500 in 80 AB)
- Hilton Smith (1 IP, 0 H)
Monday, April 28, 2014
Sunday, April 27, 2014
Last Week for FA Pickups
Reminders
- Trade deadline has passed (8/31)
- This is the last week to pick up Free Agents (end of Sim 11)
- Though, you can pick up FAs for injury replacements rest of season.
Saturday, April 26, 2014
Friday, April 25, 2014
Pinata Beaters Have a Chance at Somewhat Rare Feat
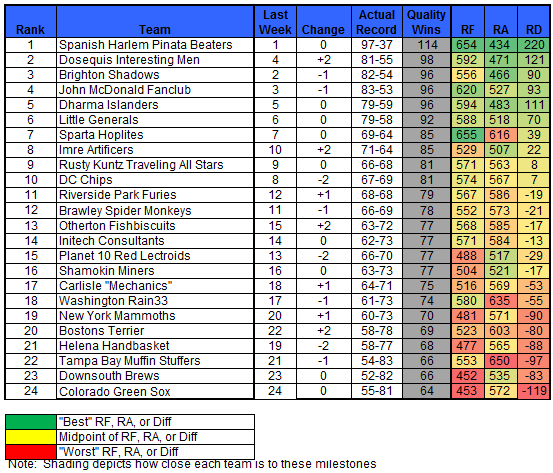
Spanish Harlem currently leads ATB in run prevention, allowing only 434 runs, an incredible 3.2 runs against per game. This is not the purpose of the post, but incidentally, that pace is 20 runs better than the record set by Sparta last year.
Spanish Harlem is also very close to leading the league in runs scored, further incidentally, just 1 run behind this years version of the Sparta Hoplites. Here, Sparta has played 1 less game and realistically has about a 5 run advantage at this point.
How often has a team led the league in both Runs For and Runs Against? It's actually not even the first time Justin has accomplish the feat, as his 108 win ATB 7 team, the Franklin Lakes Pillpoppers, were the first on record with the honor. At the time rookie owner Steve C also matched the feat in ATB 10 with the inaugural season of the DC Chip Franchise, one that won 113 games.
My vote goes to DC since they were the most balanced, but man, Franklin Lakes was leaps ahead of everyone in preventing runs in ATB 7. The values for the Beaters this year are projections, and leading the league in Runs Scored is certainly in doubt.
All of this is academic though, the Beaters are on pace for 117 wins and that will make them the best ATB of all time.
All of this is academic though, the Beaters are on pace for 117 wins and that will make them the best ATB of all time.
Week 11 Transactions
Otherton
- Pick up Jesse Barfield 1986, drop Casey Janssen
- Pick up Willie Wilson 1980, drop Brad Lidge
Chips
- Pick up Bert Blyleven 1977, drop Dick Hughes
- Pick up Dave Stieb 1985, drop Mike Garcia
Players of the Week - Clean Sweep for Dos Equis
Thursday, April 24, 2014
Rest of Way Projections for Wild Card Contenders
Well, this was a tremendous amount of work (all fun) to basically conclude the standings we see today are the standings we'll see at the end of the season. There are some minor fluctuations of course, but nothing out of the ordinary is expected to occur based upon strength of schedule, home/road splits, Pythagorean standings, etc.
First the chart
Lets look at the Sparta Hoplites to explain what this chart shows:
First the chart
 |
| Please Click to Enlarge |
- Sparta currently has 67 wins for a .511 winning percentage
- Their Pythagorean winning percentage is .525
- Weighting Pythag a bit higher (3 to 2), Sparta's effective winning percentage is .520
- They are currently 1 game back of Imre for the NL Wild Card slot
- Sparta has 31 games remaining, 21 of which are at home.
- This is very good news for them, since to date, their home winning percentage is quite good at .617.
- The combined winning percentage of their opponents, weighted by the # if games remaining, is only .473
- Using a Bill James formula to predict the outcome of each game Sparta has remaining, I was able to determine the expected winning percentage the team will have the rest of the way.
- This includes a boost for games Sparta plays at home.
- So, this .520 Wpct team, with 21 of their remaining 31 games to be played at home where they enjoy a .617 Wpct, face off against an aggregate opponent win percentage of .473, should go 19-12 the rest of the way and end the season with 86 wins.
Unfortunately for Sparta, Imre's remaining strength of schedule is even worse, and they should go 18-11 the rest of the way and finish with 87 wins.
Over in the AL, DC should squeak out a 1 game win over Planet 10 as well.
This was run for each team within 6 games of the wild card.
Wednesday, April 23, 2014
Tuesday, April 22, 2014
No DH and How it Impacts Scoring
Last season, ten teams finished the year with a team ERA north of 4.30 and the league as whole came in with a 4.02 average ERA. This season, no team is north of 4.30 and the league average is 3.66. Strikeouts per game, hits per game, and K/BB ratio are all within 5% of their ATB XV figures, but home runs per game are down about 20% - a massive hit.
The league average slash stats bear this out:
ATB 15 - .255 / .317 / .405
ATB 16 - .253 / .315 / .380
Of course, this is the direct result of losing skilled DH players in our every day lineups. The regular DH's last year compiled 12,148 at bats and this year, assuming the same playing time for the rest of the way, those same players will compile just 8,597 at bats, a 29.2% reduction.
Which DHs have lost the most playing time? Will Clark leads the list with 618 AB's last year compared with a pace of just 83 this season. Here is a table depicting the difference in AB between seasons and last seasons SLG. For example, last year Clark slugged .369 and he lost 535 at bats.
That's a considerable mount of power. What say you, in ATB 17 are you happy with the current model or do you want the DH to return?
Monday, April 21, 2014
Sunday, April 20, 2014
Imre and Otherton Announce 6 Player Deal
To Imre
Kevin Brown
Hong Chi Kuo
George Gore
To Otherton
Warren Hacker
Hilton Smith
George Stone
Kevin Brown
Hong Chi Kuo
George Gore
To Otherton
Warren Hacker
Hilton Smith
George Stone
Saturday, April 19, 2014
Week 10 Transactions
Miners
- PU Charlie Maxwell 1956, waive Andy Pafko
- PU Newt Allen 1929, waive Ben Zobrist
- PU Miguel Montero 2012, waive Johnny Bassler
Hoplites
- PU Caleb Thielbar, drop Tony Watson
Interesting Men
- PU Scott Atchison 2012, drop Roberto Hernandez
Friday, April 18, 2014
Players of the Week
Sim 9E Complete
Gents - had a family emergency last night, thankfully, all is stable now, but prevented me from posting 9E. Here it is.
If anyone ones more time for FA's, have at it, they are due 5:00 AM Saturday - a 24 hour delay.
If anyone ones more time for FA's, have at it, they are due 5:00 AM Saturday - a 24 hour delay.
Thursday, April 17, 2014
Pitchers at the Plate - Who Cares!
One of the draft strategies I employed this year was targeting pitchers that had some ability at the plate. As far as I can tell this was a poor strategy, mainly due to the random variation of so few relative at bats. Teams are averaging about 280 at bats for their entire pitching staffs and when you compare that to 3800 at bats for the rest of the lineup, the impact is marginal. With so few at bats, even the best hitting pitcher of all time can have a poor 50 AB stretch, wrecking all potential gain from the strategy. Alternatively, the worst hitting hurler can have a great 50 AB stretch too.
Taking it one step further, I was able to target 3 starting pitchers who truly showed very good real life stats, but they have comprised only 30% of all my pitcher at bats and 7% of my total at bats. It's more than noise in the grand scheme of things, but not much.
Below is a quick chart that depicts OPS scores for all batters and pitchers by team. The best hitting staff in the game belongs to John McDonald Fanclub. Led by Bob Caruthers (.364 / .486 / .600) and Jim Tobin (.270 / .300 / .350) Jason B has set the standard. Interestingly, these two hardly pitch at all, rather, their AB's are coming from pinch hitting duties.
Excluding John McDonald, the next best team is Colorado. Al Orth is batting .240 / .230 / .240 and The Big Train .210 / .240 / .340
If interested, here is a complete list of totals for each team - pitcher vs batter.
Subscribe to:
Comments (Atom)


