
DMB generally regresses all players to some sort of theoretical average. For instance, Babe Ruth doesn’t maintain his real life 1.378 OPS, he regresses towards a league average and ends up with a 1.000 OPS. He is still the best batter in both Real Life and the world of DMB, it’s just that DMB accounts for a reduction in quality because Ruth is facing stiff competition every day.
We do not know how DMB does this, and more importantly, we don’t know which stats DMB values over others or how those stats are compared to the league averages. However, we hopefully can get an idea of which era’s give the DMB engine more fits than others.
As it turns out, DMB is a harsh mistress. Out of 499 qualified batting seasons, not one individual player saw their OPS improve from their real life average. Overall, DMB reduces a player's OPS by an average of 25%
1884 Candy Nelson was impacted the least, with his OPS dropping just 2 percent from .682 to .665. However, with a real life OPS that low he is a true oddity and not representative of the typical player drafted in ATB. 1884 Orator Shaffer was next on the list, is more of a typical player, and saw ‘only’ a 10% reduction in OPS (.900 down to .813).
In third is 1876 Ross Barnes and a trend has emerged. The three players who hold up the best are all from the 1800s and incredibly, out of the top 20, only two were outside the dead ball era (pre 1919).

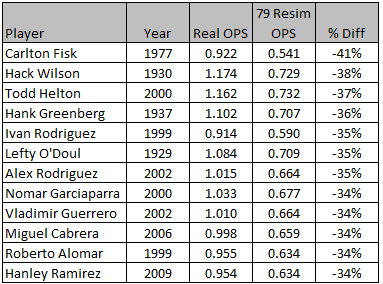
There is a similar trend at the opposite end of the spectrum, though not as pronounced. While 1977 Carlton Fisk easily takes the biggest hit, with an OPS drop of 41% (.922 down to .541) and 1930 Hack Wilson is in second, with a 38% drop (1.174 down to .729), the current era players are at an extreme disadvantage. Out of the 12 most impacted players, 9 are from 1999 or later.
Below is a timeline for the batters, with the percent difference in OPS plotted against the player year. The dots represent the actual average OPS difference for that year in particular, and the blue line is the 5-month rolling average trend.

The 1906-1917 sweet spot is obvious. During this period batters averaged just an 18% dip in OPS, and that drops to 16% when excluding 1911 and 1912.
Within this group there are some gems. Three all time greats – Honus Wagner, Ty Cobb, and Tris Speaker – highlight this cast, but even as a whole this time period outperforms every other. These outfielders averaged an 14.5% drop in OPS – stellar – but twenty others also saw OPS reductions of less than 20% and every single player in the study performed better than the -25% historical average.

I mentioned the two outlying years during this time frame, 1911 and 1912. Nine players had enough at bats to qualify, collectively averaging a 23% drop in OPS. To put that in perspective, a .900 OPS reduces to .756 with a 16% decline, and down to .693 with the 23% decline of 1911-1912.
Here’s the exact numbers by year:
-16% - 1906
-15% - 1908
-13% - 1909
-19% - 1910
-22% - 1911
-23% - 1912
-19% - 1914
-18% - 1915
-14% - 1917
Excepting 1909, the trend in this 12 year period follows a normal distribution pattern, peaking in 1911 and 1912 with – Ty Cobb and Tris Speaker, among others such as Heinie Zimmerman, Sam Crawford, and Joe Jackson all appear in this two year period. These are good players, but due to the specific yearly averages of the league, DMB treats them harshly.
The conclusion? Take a flyer on some new players during this 1906-1917 period, but steer clear from 1910-1915, and specifically 1911 and 1912.
While there are a few other peaks, one other specifically needs to be mentioned.
- After a relatively lackluster 1930s, the war years 1943-1948 are generally kind to batters. Phil Caverretta, Stan Spence, Stan Hack, Mickey Vernon, Dixie Walker, Stan Musial and more all had respectful declines in OPS. 1947 stands out as being particularly brutal, with Ralph Kiner and Johnny Mize combining to average a 30% decline in OPS.
- The 1950s through mid 1980s are relatively stable with two minor exceptions. The late 1960s/Early 1970s has a noticeable drop thanks to Johnny Bench, Jim Wynn, Frank Howard, Rico Petrocelli, Harmon Killebrew and to a lesser extent Roberto Clemente. The late 70s/early 80s are also periods to avoid, with Dwight Evans, Mike Schmidt, Gary Carter, Toby Harah, and Davey Lopes all struggling
- Finally, it appears the worst period of all is our current era of the 2000s. At first glance, I chalked this up to a selection bias. We are collectively most familiar with players from our own era and naturally gravitate towards selecting them on draft day. Indeed, a case can be made that players such as Edgar Renteria (-33%), Rich Aurilia (-32%), JD Drew (-32%), Jason Varitek (-30%) and others don’t belong in ATB to begin with. However, true greats from our era also struggle:
-34% - 2002 Vladimir Guerrero
-34% - 2006 Miguel Cabrera
-33% - 2007 Hanley Ramirez
-33% - 2007 Jimmy Rollins
-31% - 2006 Albert Pujols
-31% - Sammy Sosa
The list goes on and on. In fact, only 6 of 70 players come in better than the historical ATB average of a 25% reduction of OPS.
What should we do with this information? Frankly, the majority of us will completely disregard and that may not be the worst idea. I would not suggest that anyone avoids any player in particular because of this study. However, if you are looking to take a flyer on two players that appear to be equal, take the one from the dead ball era and avoid the one from our current era.
I have yet to take a successful flier on a recent hitter ('11 Bautista, '11 Tulo) but I usually do very well on recent vintage pitchers.
ReplyDeleteI do need to try and repeat this exercise for pitchers. The recent ones, especially closers, seem to kick ass.
ReplyDeleteSeems perfectly normal to me!! Not all OPS are created equally anyways. The way Candy Nelson produces his meager OPS (all BBs) translates extremely well to ATB.
ReplyDeleteI remember my harmon Killebrew season.... Ouch!!
ReplyDelete