
A centralized Diamond Mind Baseball league, using every full time player from 1871 'till today.
Saturday, March 31, 2012
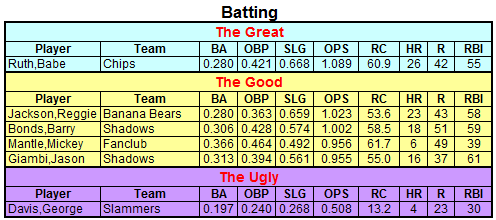
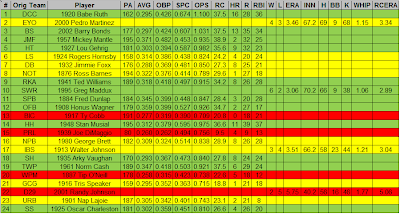
AL All Star Candidates
Onto the AL...
Catcher
Deacon is the best all around hitter of the bunch but Lopez is having a monster power season.
0.360 / 0.411 / 0.419 // 0 HR, 18 R,, 9 RBI, 0.363 ATB V, 0.830 OPS White,Deacon DCC
0.278 / 0.310 / 0.468 / 11 HR, 19 R, 31 RBI, 0.308 ATB V, 0.778 OPS Lopez,Javy PRL
0.305 / 0.399 / 0.379 // 0 HR, 34 R, 24 RBI, 0.335 ATB V, 0.778 OPS Carroll,Fred BIC
0.261 / 0.326 / 0.449 // 7 HR, 25 R, 26 RBI, 0.242 ATB V, 0.775 OPS Hartnett,Gabby IBS
0.324 / 0.357 / 0.392 // 3 HR, 22 R, 23 RBI, 0.310 ATB V, 0.749 OPS Mauer,Joe TWP
0.287 / 0.364 / 0.374 // 2 HR, 18 R, 21 RBI, 0.336 ATB V, 0.738 OPS Posada,Jorge D29
First Base
McGwire and his 22 HR and 50+ RBI is the obvious choice, but may owners in this league might prefer Cash.
0.229 / 0.357 / 0.502 / 22 HR, 38 R, 53 RBI, 0.318 ATB V, 0.859 OPS McGwire,Mark SPB
0.307 / 0.380 / 0.436 // 8 HR, 40 R, 35 RBI, 0.312 ATB V, 0.816 OPS Cash,Norm TWP
0.254 / 0.312 / 0.480 / 15 HR, 34 R, 43 RBI, 0.317 ATB V, 0.792 OPS Bagwell,Jeff PRL
0.353 / 0.405 / 0.382 // 0 HR, 33 R, 36 RBI, 0.353 ATB V, 0.787 OPS Connor,Roger GCG
Second Base
Dunlap with the slight edge, even though Lajoie is better with the glove.
0.324 / 0.380 / 0.424 / 5 HR, 36 R, 43 RBI, 0.308 ATB V, 0.804 OPS Dunlap,Fred SPB
0.316 / 0.358 / 0.408 / 3 HR, 36 R, 15 RBI, 0.317 ATB V, 0.766 OPS Lajoie,Nap URB
0.322 / 0.361 / 0.398 / 1 HR, 31 R, 29 RBI, 0.348 ATB V, 0.759 OPS Robinson,Jackie D29
0.263 / 0.356 / 0.371 / 2 HR, 36 R, 25 RBI, 0.318 ATB V, 0.727 OPS Zobrist,Ben BIC
Third Base
Does McGraw's .425 OBP outweigh Baker's .832 OPS? Not quite, at least for now.
0.333 / 0.370 / 0.462 // 3 HR, 33 R, 31 RBI, 0.350 ATB V, 0.832 OPS Baker,Frank BIC
0.266 / 0.300 / 0.450 / 15 HR, 33 R, 46 RBI, 0.314 ATB V, 0.750 OPS Beltre,Adrian D29
0.270 / 0.425 / 0.283 // 1 HR, 36 R, 25 RBI, 0.366 ATB V, 0.708 OPS McGraw,John GCG
Shortstop
Close race, but Vaughn has the edge due to his defense and playing in less of a batters park.
0.318 / 0.349 / 0.428 / 5 HR, 41 R, 27 RBI, 0.309 ATB V, 0.777 OPS Trammell,Alan TWP
0.279 / 0.360 / 0.411 / 9 HR, 40 R, 28 RBI, 0.336 ATB V, 0.770 OPS Vaughan,Arky SH
Left Field
Virtually no chance Bonds isn't name the starting left fielder.
0.307 / 0.431 / 0.568 / 19 HR, 55 R, 61 RBI, 0.414 ATB V, 0.999 OPS Bonds,Barry BS
0.305 / 0.365 / 0.453 // 6 HR, 22 R, 31 RBI, 0.367 ATB V, 0.817 OPS Williams,Ken BS
0.292 / 0.347 / 0.427 // 5 HR, 31 R, 18 RBI, 0.346 ATB V, 0.774 OPS O'Neill,Tip WPM
Center Field
Mays having a great year ... in a batters park
0.296 / 0.345 / 0.589 / 23 HR, 45 R, 56 RBI, 0.278 ATB V, 0.934 OPS Mays,Willie IBS
0.335 / 0.396 / 0.402 // 2 HR, 38 R, 32 RBI, 0.382 ATB V, 0.798 OPS Speaker,Tris GCG
0.309 / 0.377 / 0.410 // 4 HR, 44 R, 35 RBI, 0.314 ATB V, 0.786 OPS Kauff,Benny TWP
Right Field
Ruth will easily win, but that doesn't mean we can't admire a great year out of the Canadian
0.296 / 0.434 / 0.704 / 29 HR, 45 R, 63 RBI, 0.431 ATB V, 1.138 OPS Ruth,Babe DCC
0.278 / 0.371 / 0.498 / 13 HR, 32 R, 34 RBI, 0.385 ATB V, 0.869 OPS Walker,Larry WPM
Designated Hitter
I listed two but Giambi is top of DH class by a wide margin.
0.325 / 0.401 / 0.590 / 19 HR, 43 R, 68 RBI, 0.364 ATB V, 0.991 OPS Giambi,Jason BS
0.301 / 0.348 / 0.401 // 3 HR, 31 R, 33 RBI, 0.280 ATB V, 0.750 OPS Herman,Babe SH
Power Alley Update

+5: Sparta Hoplites
+4: Brighton Shadows
-4: Planet 10
-3: Rusty Kuntz
-3: St Louis
-3: Indiana
NL All Star Candidates
It's the middle of June and the All-Star game is quickly approaching. Below are the front runners for the starting positions in the National League. Pester me to make a case for your guy if you wish!
Catcher
Great race between four good catchers. Dickey has the edge... for now
0.330 / 0.360 / 0.475 // 4 HR, 23 R, 29 RBI, 0.372 ATB V, 0.835 OPS Dickey,Bill DB
0.330 / 0.373 / 0.450 // 5 HR, 26 R, 28 RBI, 0.338 ATB V, 0.823 OPS Piazza,Mike LS
0.261 / 0.333 / 0.463 / 13 HR, 33 R, 35 RBI, 0.326 ATB V, 0.797 OPS Gibson,Josh SWR
0.319 / 0.398 / 0.384 // 1 HR, 31 R, 26 RBI, 0.3342 ATB V, 0.782 OPS Kelly,King EYO
First Base
Lou Gehrig is a virtual shoe-in. He leads NL first basemen in slugging, OPS, triples, home runs, runs, and RBI. He also leads in advanced metrics such as ATB Value, Runs Created, and RC/27
0.295 / 0.372 / 0.624 / 18 HR, 55 R, 50 RBI, 0.385 ATB V, 0.996 OPS Gehrig,Lou HT
0.295 / 0.365 / 0.528 / 17 HR, 47 R, 50 RBI, 0.369 ATB V, 0.893 OPS Foxx,Jimmie DB
0.314 / 0.375 / 0.458 // 3 HR, 40 R, 45 RBI, 0.351 ATB V, 0.833 OPS Brouthers,Dan NOT
0.326 / 0.385 / 0.479 / 10 HR, 35 R, 40 RBI, 0.369 ATB V, 0.864 OPS Pujols,Albert LS
Second Base
A two horse race, in which the value of defense will be put to the test
0.295 / 0.376 / 0.423 / 6 HR, 36 R, 37 RBI, 0.348 ATB V, 0.799 OPS Hornsby,Rogers LS
0.316 / 0.369 / 0.392 / 1 HR, 43 R, 28 RBI, 0.356 ATB V, 0.762 OPS Barnes,Ross NOT
Third Base
How great it is to see Mike Schmidt in his rightful place. Likely gets the nod over George Brett
0.315 / 0.348 / 0.510 / 13 HR, 44 R, 42 RBI, 0.367 ATB V, 0.858 OPS Brett,George NPB
0.279 / 0.366 / 0.461 / 14 HR, 37 R, 43 RBI, 0.377 ATB V, 0.827 OPS Schmidt,Mike NOT
0.240 / 0.338 / 0.451 / 14 HR, 38 R, 37 RBI, 0.342 ATB V, 0.789 OPS Mathews,Eddie HT
Shortstop
Wagner does it all, and Jennings ability to get on base doesn't quite make up for the 140 point lead in OPS
0.330 / 0.368 / 0.505 / 5 HR, 46 R, 30 RBI, 0.377 ATB V, 0.874 OPS Wagner,Honus OFB
0.343 / 0.422 / 0.359 / 0 HR, 43 R, 15 RBI, 0.374 ATB V, 0.781 OPS Jennings,Hughie EYO
0.288 / 0.357 / 0.376 / 3 HR, 41 R, 21 RBI, 0.328 ATB V, 0.733 OPS Jeter,Derek DB
Left Field
A tight race absent any stars; toss up between Rickey and Goose.
0.278 / 0.364 / 0.458 / 11 HR, 45 R, 24 RBI, 0.350 ATB V, 0.822 OPS Henderson,Rickey NPB
0.322 / 0.369 / 0.444 // 4 HR, 32 R, 31 RBI, 0.348 ATB V, 0.814 OPS Goslin,Goose SWR
0.273 / 0.347 / 0.421 / 11 HR, 27 R, 52 RBI, 0.333 ATB V, 0.768 OPS Yastrzemski,Carl JMF
Center Field
Mantle has always been the best in the biz, this year is no different
0.358 / 0.462 / 0.487 // 7 HR, 54 R, 41 RBI, 0.421 ATB V, 0.949 OPS Mantle,Mickey JMF
0.265 / 0.307 / 0.447 / 14 HR, 43 R, 46 RBI, 0.314 ATB V, 0.754 OPS Griffey Jr.,Ken NPB
0.297 / 0.351 / 0.470 // 9 HR, 39 R, 42 RBI, 0.339 ATB V, 0.821 OPS Snider,Duke SWR
0.309 / 0.376 / 0.430 // 6 HR, 40 R, 32 RBI, 0.352 ATB V, 0.806 OPS Charleston,Oscar SS
Right Field
Mr. Total Base himself, Stan Musial, is the clear front runner
0.304 / 0.368 / 0.555 / 15 HR, 52 R, 53 RBI, 0.355 ATB V, 0.923 OPS Musial,Stan HH
0.301 / 0.349 / 0.435 // 1 HR, 29 R, 36 RBI, 0.304 ATB V, 0.784 OPS Thompson,Sam SWR
0.304 / 0.331 / 0.435 // 9 HR, 33 R, 31 RBI, 0.322 ATB V, 0.766 OPS Klein,Chuck SS
Designated Hitter
Reggie over Teddie? Looks like it. The next two weeks will decide for certain.
0.272 / 0.356 / 0.626 / 23 HR, 44 R, 60 RBI, 0.364 ATB V, 0.982 OPS Jackson,Reggie NPB
0.327 / 0.423 / 0.508 / 14 HR, 42 R, 50 RBI, 0.346 ATB V, 0.930 OPS Williams,Ted RKA
0.278 / 0.305 / 0.516 / 21 HR, 44 R, 62 RBI, 0.302 ATB V, 0.821 OPS Aaron,Hank OFB
Friday, March 30, 2012
Standings Summary - Week 5

The water cooler around the National League this week centered around the Otherton Fishbiscuits. With a 10-5 record during the Sim, the Fishbiscuits took sole possession of first place in the National League West. Pitching was their key to success. Starters Lefty Stewart (2-1, 1.59 ERA), Dizzy Dean (2-0, 2.30 ERA), and Noodles Hahn (2-1, 2.67 ERA) all pitched extremely well, but the bullpen was even better. Hong-Chih Kuo, Tom Glavine, Al Grabowski, Keith Foulke, and Kent Tekulve combined for a stellar line of : 34.2 IP, 26 H, 1.04 ERA.
After a dismal Week 4, Helena Handbasket played 2 games over .500 and moved back into the playoff picture with a 1/2 game lead on Rusty Kuntz. Those All-Stars struggled a bit thanks to a very poor showing from the bulk of the starting rotation. Al Roth, Ben Sheets, Pascual Perez, and Catfish Hunter combined to go 0-4 with an ERA over 10.00.
Lastly in the West, John McDonald Fanclub is starting to make some noise themselves. With an 8-6 week they're now over .500 on the season and are within a game and a half of the Wild Card. This is the tightest race in baseball, with 4 of the 6 teams in the Division within 1.5 games of a playoff spot.
The only team to make a move in the National League East were the Haven Tommyknockers. Lou Gehrig pounded 5 home runs and drove in 12, while Cy Blanton (2-0, 2.11) and Jonathan Papelbon (5 Sv, 1.59 ERA). Haven went 9-4 on the week and are now in the Wild Card lead.
The rest of the division all played around .500 ball, without much fanfare for good or ill.
Week 4 Hero's
Jim Gentile (Banana Bears) - .345 / .387 / .690, 6 HR, 13 RBI
Jimmie Foxx (Brews) - 4 HR, 16 RBI
Ted Williams (All Stars) - .418 / .508 / .655, 12 R, 14 RBI
Greg Maddux (White Rats) - 3-0, 2.16 ERA
Ted Lilly (Thrill) - 3-0, 0.86 ERA
Rafael Betancourt (Orators) - 12.1 IP, 0 R, 11 K
Russ Ford (Snow) - 22 IP, 15 H, 3 BB, 20 K
John Tudor (Handbasket) - 26 IP, 1.37 ERA
Thursday, March 29, 2012
Players of the Week


ATB Value Update
Full file here
Average wOBA by Position
.327 - 1B
.323 - DH
.316 - CF
.312 - LF
.310 - RF
.309 - 3B
.305 - 2B
.295 - C
.285 - SS
Catcher
0.378 - Rodriguez,Ivan, BS
0.372 - Dickey,Bill, DB
0.363 - White,Deacon, DCC
0.338 - Piazza,Mike, LS
0.336 - Posada,Jorge, D29
First Base
0.385 - Gehrig,Lou, HT
0.369 - Foxx,Jimmie, DB
0.369 - Pujols,Albert, LS
0.353 - Connor,Roger, GCG
0.351 - Brouthers,Dan, NOT
Second Base
0.357 - Barnes,Ross, NOT
0.348 - Hornsby,Rogers, LS
0.348 - Robinson,Jackie, D29
0.324 - Stanky,Eddie, BS
0.324 - Whitaker,Lou, SS
Third Base
0.377 - Schmidt,Mike, NOT
0.368 - Brett,George, NPB
0.366 - McGraw,John, GCG
0.350 - Baker,Frank, BIC
0.342 - Jones,Chipper, HH
Shortstop
0.377 - Wagner,Honus, OFB
0.373 - Jennings,Hughie, EYO
0.335 - Vaughan,Arky, SH
0.328 - Jeter,Derek, DB
0.323 - Sewell,Joe, JMF
Left Field
0.414 - Bonds,Barry, BS
0.367 - Williams,Ken, BS
0.350 - Henderson,Rickey, NPB
0.348 - Goslin,Goose, SWR
0.346 - O'Neill,Tip, WPM
Center Field
0.421 - Mantle,Mickey, JMF
0.382 - Speaker,Tris, GCG
0.352 - Charleston,Oscar, SS
0.348 - Combs,Earle, NOT
0.339 - Snider,Duke, SWR
Right Field
0.431 - Ruth,Babe, DCC
0.385 - Walker,Larry, WPM
0.355 - Musial,Stan, HH
0.322 - Klein,Chuck, SS
0.315 - Guerrero,Vladimir, D29
Designated Hitter
0.364 - Jackson,Reggie, NPB
0.364 - Giambi,Jason, BS
0.347 - Williams,Ted, RKA
0.344 - Hafner,Travis, SPB
0.314 - Joyce,Bill, SS
RSAA Update
Full File Here
Starting Pitchers
-22.0: Blanton,Cy 1935 - 2.1 RCERA (HT)
-19.1: Haren,Danny 2009 - 2.22 RCERA (BIC)
-17.3: Schilling,Curt 2002 - 2.44 RCERA (BIC)
-16.8: Reuss,Jerry 1980 - 2.24 RCERA (BIC)
-15.6: Hubbell,Carl 1936 - 2.66 RCERA (GCG)
-14.7: Potter,Nels 1945 - 2.48 RCERA (PRL)
-14.4: Maddux,Greg 1995 - 2.73 RCERA (SWR)
-14.2: Martinez,Pedro 2000 - 2.81 RCERA (EYO)
-14.2: Koufax,Sandy 1965 - 2.47 RCERA (SS)
-13.9: Mitchell,Willie 1913 - 1.65 RCERA (WPM)
Closer's
-12.0: Meredith,Cla 2006 - 0.59 RCERA (SPB)
-11.6: White,Gabe 2000 - 1.64 RCERA (DCC)
-7.0: Soria,Joakim 2008 - 1.09 RCERA (WPM)
-6.8: Zimmerman,Jeff 1999 - 1.65 RCERA (BIC)
-6.0: Tekulve,Kent 1983 - 1.06 RCERA (OFB)
-5.9: Papelbon,Jonathan 2006 - 1.22 RCERA (HT)
-5.4: Howe,Steve 1994 - 2.37 RCERA (BIC)
-5.2: Wagner,Billy 1999 - 2.07 RCERA (PRL)
-5.0: Putz,J.J. 2007 - 1.93 RCERA (RKA)
-4.4: Saito,Takashi 2007 - 1.53 RCERA (IBS)
Relief Pitchers
-9.1: Berry,Joe 1944 - 2.17 RCERA (HH)
-9.0: Burke,Tim 1987 - 2.2 RCERA (GCG)
-9.0: Eckersley,Dennis 1990 - 2.1 RCERA (DCC)
-7.9: Abernathy,Ted 1967 - 2.5 RCERA (DB)
-7.2: Fernandez,Sid 1985 - 1.88 RCERA (SS)
-7.1: Jackson,Grant 1973 - 2.01 RCERA (NPB)
-7.1: Hiller,John 1973 - 2.14 RCERA (WPM)
-6.5: Neale,Joe 1890 - 2.8 RCERA (NOT)
-5.8: Quinn,Jack 1918 - 2 RCERA (WPM)
-5.6: Ryan,B.J. 2006 - 2.23 RCERA (GCG)
Scrolling Through the Leader Boards Makes Me Happy
I was scrolling through the leader boards last night and it struck me how great an idea leader boards are in the first place. (Well, first it struck me that baseball itself is so great that someone actually thought it was a good idea sink a lot of money into a computer game that would allow 24 nutty fans watch a fictitious universe play out on one man's laptop over the course of 16 weeks. And then want to do it again eight months later. We are the epitome of the "mother's basement" stereotype.)
Anyway, the ATB leader boards are particularly exciting to peruse this year as so many categories are littered with names that normally wouldn't grace any top 10 lists.
For instance, Joe Mauer (TWP) is batting .333 in 213 at bats. His career ATB average is .279. Reggie Jackson is a good player, no doubt. He even hit 34 home runs with a .562 slugging in ATB 8 for the Franklin Lakes Pillpoppers, driving in 168 (!). This year he already has 23 home runs and is slugging .650 and is arguably the MVP of the league for the Banana Bears.
Elsewhere, the career .674 OPS Jimmy Williams (EYO) has a .744 OPS and is tied for the league lead in triples at 9, Willie McGee (HT) is second in the league in stolen bases, and Lou Boudreau (URB) is hitting .456 versus lefties.
And the batters have nothing on their counterparts. One glance at the Top-10 ERA charts is enough to make your eyes bulge. Not one pitcher with a Top-10 career average is mentioned in this year's Top 10, not one. New names like Verlander (BS) and Ruess (BIC) are listed next to cult favorites such as Hughson (GCG) and Blanton (HT). Others like Hubbell (GCG) and Schilling (BIC) were targeted specifically by their owners due to hunches about defense and parks.
Sandy Koufax (SS) is finally where he belongs - in the Top-10 in strikeouts, and so is Hal Newhouser (URB). My favorite though is Nels Potter (PRL) and his minuscule 2.05 ERA.
Take a stroll when you get a chance, these names might not be around for long. Remember that Dwight Gooden (TWP) start? He's now 3-5 with a 4.61 ERA.
Wednesday, March 28, 2012
Luck Makes or Breaks a Season
For argument sake, lets assume the Carnies and the Gossamers are the two best teams in the league. They are 1st and 2nd in wins and ranked 1st and 2nd in run differential.
Both teams have great home records:
BIC: 33-8
GCG: 33-11
Both teams are awesome when leading after 7:
BIC: 37-1
GCG: 33-1
Both are great at come from behind wins, trailing after 7:
BIC: 6 wins
GCG: 7 wins
The real difference between the two teams? 1-run games
BIC: 20-2
GCG: 13-11
That folks, is just not sustainable.
Holding the Carnies aside, the rest of the league has a combined .479 winning percentage in 1-run games, the Carnies are enjoying a .919 winning percentage. There is a Carnie correction coming soon, the laws of statistics say its inevitable.
Good to See My Alma Mater Is Making A Difference
NJIT professor and mathematician Bruce Bukiet has been publishing projections of the baseball standings since 2000. Here are his for 2012.
http://www.miller-mccune.com/culture/mlb-prediction-cardinals-to-lead-nl-in-wins-40692/
http://www.miller-mccune.com/culture/mlb-prediction-cardinals-to-lead-nl-in-wins-40692/

What a Difference A Year Makes
Last season starting pitchers compiled a 4.41 ERA. This season, starters are running an ERA of just 3.92, a very significant 11% improvement. Reliever ERA has improved 5%, dropping from an average of 3.67 to 3.49.
Not surprisingly we've seen similar changes to batters. Here are the league average stat lines per 550 AB:
ATB 13 - .275 / .338 / .393, 74 R, 18 2B, 4 3B, 12 HR, 71 RBI, 50 BB, 90 K, 4.7 R/G
ATB 14 - .266 / .325 / .375, 67 R, 17 2B, 3 3B, 12 HR, 65 RBI, 47 BB, 81 K, 4.2 R/G
What immediately comes to mind as the root cause is the focus on team defense plus the increased number of teams in the league. This season we have 24 teams, while last season there were only 18.
ATB 12 had twenty teams and ATB 11 twenty-four, adding them to the mix:
ATB 11 - .269 / .334 / .383, 71 R, 18 2B, 4 3B, 13 HR, 69 RBI, 51 BB, 90 K, 4.5 R/G
ATB 12 - .275 / .340 / .396, 74 R, 18 2B, 3 3B, 14 HR, 72 RBI, 53 BB, 93 K, 4.7 R/G
ATB 13 - .275 / .338 / .393, 74 R, 18 2B, 4 3B, 12 HR, 71 RBI, 50 BB, 90 K, 4.7 R/G
ATB 14 - .266 / .325 / .375, 67 R, 17 2B, 3 3B, 12 HR, 65 RBI, 47 BB, 81 K, 4.2 R/G
This is quite interesting. While no definitive conclusion can be drawn from the above, in all likelihood the increased number of teams account for approximately half the reason pitching is improved across the board while the other half appears to be the effect of better defense and better drafting due to improved owner knowledge, thanks to more experience and of course the 79-resims.
ATB 12 and 13 averaged a .746 OPS with a similar number of teams. ATB 11 averaged a .728 OPS, an 18 point improvement, that is almost assuredly due to the 24-team format. The only aspect of the game that has changed between ATB 11 and this season, is the choice of players. This season, batters are averaging a .714 OPS, a 14 point drop from ATB 11. Runs Per game follows a similar symmetrical drop from 4.7 to 4.5 to 4.2.
I don't think any of this means a whole lot, the playing field is level across all teams, but it is intriguing nonetheless. One aspect that might change all this is the weather. The DMB program accounts for increased hitting productivity as the weather warms. There is a chance by the end of the year the average stat line will be similar to that of the previous two season, but I find it hard to believe it will fully make up the difference.

Tuesday, March 27, 2012
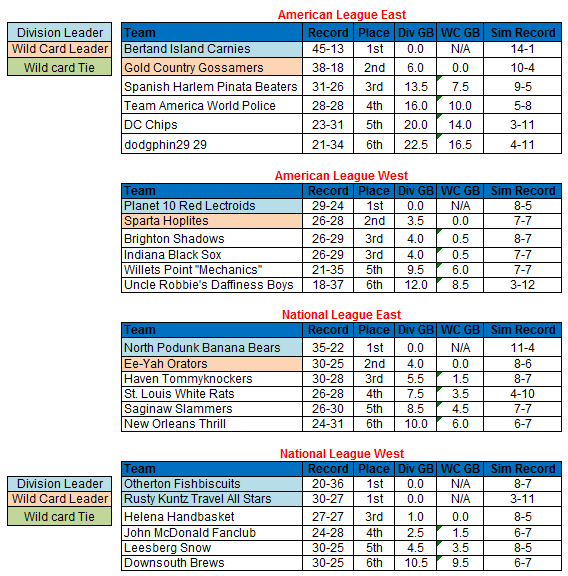
Races Tighten
At the end of play today three of the four divisions are in extremely close races for either the Wild Card, Division Title, or both. Fun stuff:

- In the AL West the Red Lectroids, Black Sox, and Shadows are all tied for first with the Hoplites just 2.5 games out.
- In he NL East the Banana Bears have 5.5 game cushion for the division lead, but the Wild Card race is tight. The Orators lead the Tommyknockers by 1.5 games and the White Rats by 3.5. Even the 5th and 6th place teams are within striking distance, 4.5 and 6 games out of the Wild Card.
- The NL West has the Fishbiscuits clinging to a 1 game lead on the All Stars, while the All Stars in turn have a 1.5 game lead on Handbaskets and 2.5 game lead on the fanclub.
- Even the AL East may bet interesting, as the third place Pinata Beaters have won 9 of 10 but still find themselves 6.5 games out of the wild card.


Monday, March 26, 2012

Koufax Continues To Shine
As of this writing, Sandy Koufax has 5 wins and a 3.00 ERA. In 81 innings he's given up just 65 hits and struck out 73 against 21 walks, good enough for a1.06 WHIP. Great stuff.
Even better, Koufax is in the midst of a 22 scoreless innings streak. After struggling early against the Orators on May 26, he shut them down for 4 innings before giving way to the Slammers relief corp. In his two games since, he's tossed two complete game shutouts, striking out 16 and walking 2.
Koufax has a chance to be legit, although certainly not this good. This 1965 season chosen had only been used one other time, back in ATB 8. With a 7-18 record and 6.02 ERA he was awful, but he played on a horrid team in a pitchers park.
In the 79 resims he held his own with a 4.08 ERA, 1.34 WHIP leading me to believe at least one of those 79 seasons was very, very good.
Sunday, March 25, 2012


Saturday, March 24, 2012
Power Alley - Week 4

+9: Planet 10 Red Lectroids
+7: John McDonald Fanclub
+6: Spanish Harlem Pinata Beaters
+4: New Orleans Thrill
-6: St. Louis White Rats
-6: Sparta Hoplites
-7: DC Chips
-8: Helena Handbasket
-9: Team America World Police
Friday, March 23, 2012
Standings Summary - Week 4
Not much has really changed in the West. The Red Lectroids remain the division leaders, despite a negative run differential; the Sparta Hoplites remain the Wild Card leaders, despite a negative run differential. The Indiana Black Sox and the Brighton Shadows switched places 3rd and 4th, but both teams player mediocre baseball over the last 15 with records right around .500. The Daffiness boys had a horrible week, winning just 3 of 15 and are now in last place, 12 games off the pace. This did allow the Willets Point "Mechanics"to move into 5th place but both teams are struggling, very much in danger of falling too far behind to make a realistic push for the pennant.
Interestingly, the division as a whole is being smashed by the AL East. The East averages a +22 RD per team, while the West just a -23. In fact, only one team in West even has a positive RD, the third place Shadows. Much of the damage has been done by the "Big 2", which have combined to go 42-17 (.712 Wpct) against the West.
One potential positive? The preseason juggernaut Sparta Hoplites are on a 6 game winning streak and are finally showing signs of life. While their offense continued to struggle (Week 4 team OPS of .609), the pitching staff caught a fire. Starters Stan Coveleski, Zach Grienke, and Bobby Shantz combined to give up just 12 earned runs in 8 starts. The team as a whole managed a 3.12 ERA in Week 4.
It's also time we paid a little bit of attention to the Bertrand Island Carnies. Currently on pace for 126 wins, the Carnies when 14-1 on the week and show no signs of easing up (purposeful self jinx to see if this is for real). Much of the team excelled in Week 4, with 6 regulars posting OPS scores over .900 and three others over .800. The staff was just as good, if not better, turning in a team ERA of 2.12. I am not sure who was more valuable, starter Curt Schilling (3-0, 26 IP, 2 BB, 29 K, 5 R) or Mike Jackson (10 IP, 0 R) out of the pen.
The Carnies opened up only a 6 game lead on division rival Gold Country, as the Gossamers had a great week themselves winning 10 of 14. Fighting of several team injuries - at one point their Top 3 picks were all sidelined simultaneously - Tris Speaker led the way batting .411 / .476 / .500 in 13 games. Carl Hubbell was the squad's best pitcher putting up a 1.84 ERA in 4 starts.
"Nothing like going 8 for my last 10 and LOSING ground in the playoff hunt. You two are ridiculous!" This, comment, posted by the third place Pinata Beaters, just about sums up the feelings of the while division.
Week 4 Hero's
Larry Walker (WPM) - .340 / .439 / .766
Barry Bonds (BS) -.346 / 456 / .596, 18 RBI
Mark McGwire (SPB) - .283 / .450 / .674
Todd Helton (WPM) - 6 doubles
Willie Mays (IBS) - 7 HR
Fred Carroll (BIC) - 13 Runs
Billy Hamilton (DCC) - 7 SB
Jimmy Key (BS) - 3-0, 0.71 ERA
Babe Adams (SPB) - 2-1, 1.13 ERA
Curt Schilling (BIC) - 3-0, 1.73 ERA, 29 K
Dennis Eckersley (DCC) - 15 IP, 0.59 ERA
Nels Potter (PRL) - 15 IP, 0.60 ERA
Joakim Soria (WPM) - 5 Sv, 0.00 ERA
Thursday, March 22, 2012
Players of the Week


RSAA Leaders
Full List
4.01 - Avg Starter ERA
3.56 - Avg Reliever ERA
Starting Pitcher
-17.6: Blanton,Cy 1935 - 2.19 RCERA (HT)
-16.4: Reuss,Jerry 1980 - 2.12 RCERA (BIC)
-15.0: Adams,Babe 1919 - 2.38 RCERA (SPB)
-14.7: Schilling,Curt 2002 - 2.4 RCERA (BIC)
-14.3: Potter,Nels 1945 - 2.25 RCERA (PRL)
-13.4: Hughson,Tex 1946 - 2.64 RCERA (GCG)
-13.3: Gooden,Dwight 1985 - 2.46 RCERA ( )
-13.0: Haren,Danny 2009 - 2.48 RCERA (BIC)
-12.4: Lowe,Derek 2002 - 2.57 RCERA (IBS)
-12.2: Brecheen,Harry 1948 - 2.5 RCERA (NPB)
Closer
-11.2: White,Gabe 2000 - 1.54 RCERA (DCC)
-10.0: Meredith,Cla 2006 - 0.56 RCERA (SPB)
-8.3: Zimmerman,Jeff 1999 - 0.68 RCERA (BIC)
-5.7: Soria,Joakim 2008 - 1.01 RCERA (WPM)
-5.6: Wagner,Billy 1999 - 1.7 RCERA (PRL)
-5.2: Papelbon,Jonathan 2006 - 1.12 RCERA (HT)
-5.1: Tekulve,Kent 1983 - 1.06 RCERA (OFB)
-4.6: Rivera,Mariano 2008 - 1.96 RCERA (NOT)
-4.6: Putz,J.J. 2007 - 1.68 RCERA (RKA)
-4.4: Howe,Steve 1994 - 2.41 RCERA (BIC)
Relief Pitcher
-9.9: Berry,Joe 1944 - 2.08 RCERA (HH)
-9.3: Neale,Joe 1890 - 2.4 RCERA (NOT)
-8.3: Abernathy,Ted 1967 - 2.27 RCERA (DB)
-8.0: Eckersley,Dennis 1990 - 2.1 RCERA (DCC)
-7.0: Ryan,B.J. 2006 - 1.65 RCERA (GCG)
-6.5: Burke,Tim 1987 - 2.32 RCERA (GCG)
-5.8: Hall,Dick 1964 - 2.26 RCERA (JMF)
-5.7: Hiller,John 1973 - 2.09 RCERA (WPM)
-5.6: Jackson,Mike 1998 - 1.54 RCERA (BIC)
-5.1: Fernandez,Sid 1985 - 2.07 RCERA (SS)
ATB Value Update
Full Report
Average by Position
.338 - 1B
.325 - DH
.317 - CF
.311 - RF
.310 - LF
.306 - 2B
.305 - 3B
.293 - C
.284 - SS
Catcher
0.394 - White,Deacon, DCC
0.382 - Dickey,Bill, DB
0.368 - Posada,Jorge, D29
0.355 - Rodriguez,Ivan, BS
0.354 - Piazza,Mike, LS
First Base
0.401 - Pujols,Albert, LS
0.397 - Connor,Roger, GCG
0.379 - Gehrig,Lou, HT
0.371 - Brouthers,Dan, NOT
0.358 - Foxx,Jimmie, DB
Second Base
0.376 - Barnes,Ross, NOT
0.339 - Robinson,Jackie, D29
0.338 - Hornsby,Rogers, LS
0.338 - Stanky,Eddie, BS
0.333 - Lajoie,Nap, URB
Third Base
0.376 - Schmidt,Mike, NOT
0.376 - McGraw,John, GCG
0.357 - Baker,Frank, BIC
0.351 - Brett,George, NPB
0.343 - Jones,Chipper, HH
Shortstop
0.403 - Wagner,Honus, OFB
0.364 - Jennings,Hughie, EYO
0.349 - Wright,George, NOT
0.345 - Jeter,Derek, DB
0.338 - Vaughan,Arky, SH
Left Field
0.430 - Bonds,Barry, BS
0.373 - Goslin,Goose, SWR
0.371 - Yastrzemski,Carl, JMF
0.361 - Henderson,Rickey, NPB
0.360 - Hall,George, JMF
Center Field
0.422 - Mantle,Mickey, JMF
0.381 - Speaker,Tris, GCG
0.378 - Combs,Earle, NOT
0.348 - Charleston,Oscar, SS
0.345 - Snider,Duke, SWR
Right Field
0.413 - Ruth,Babe, DCC
0.399 - Walker,Larry, WPM
0.353 - Musial,Stan, HH
0.340 - Guerrero,Vladimir, D29
0.334 - Klein,Chuck, SS
Designated Hitter
0.366 - Giambi,Jason, BS
0.362 - Jackson,Reggie, NPB
0.332 - Hafner,Travis, SPB
0.331 - Williams,Ted, RKA
0.317 - Joyce,Bill, SWR
Wednesday, March 21, 2012
Great Feats Update
- Fred Dunlap sets a new hit streak record, but Nap Lajoie is just one game off the pace himself
- Someone finally steals 4 bases in a game
- And two people finally hit 3 doubles
- Plus a heck of a lot more 5 hit games, 85+ Game Scores, and two more 3-HR games
Tuesday, March 20, 2012
Move Over Grandpa
Purely for kicks and grins:
4 - New Guys
3 - Middle Guys
2 - Old Guys
These are the number of "very good or better" teams, categorized by length of ownership tenures in ATB.
The Newest owners - those with 2 years or or less ATB experience - are producing more "very good" teams than the middle owners (3-6 years experience) or the old timers (7 years or more experience).
In fact, the middle guys are out producing thew old guard too.
When looking across all teams (not just the very good ones) the total number of wins seems more reasonable, assuming the more experience one has in ATB the better one does:
208 Wins - Old Timers
199 Wins - New Guys
190 Wins - Middle
Still, nine wins is awfully close and I personally love seeing the newer owners competing much more quickly than they used to.
Note:
- It happened to work out there were 8 owners in each category:


Monday, March 19, 2012

Sunday, March 18, 2012

Quick Draft Results - Rd 1
Very quickly with no analysis, here's a view of how all of the 1st round selections are performing:

- Four Players - Ty Cobb, Joe DiMaggio, Tip O'Neill, and Randy Johnson are struggling and making their owners look bad.
- Eight players are not quite leaving up to expectations, but aren't killing their teams either - Pedro Martinez, Rogers Hornsby, Jimmie Foxx, Ross Barnes, George Brett, Walter Johnson, Tris Speaker, and Nap Lajoie
- The rest are performing at or above expectations.
Congrats to the green owners! Sorry for the red, I think only Joe D is virtually assured of turning it around.
- Randy Johnson is a new year, and a gamble
- Tip O'Neill was an 1800s reset
- Ty Cobb was an odd year choice, and any year of Cobb can backfire. He is a boom or bust type player historically,

Saturday, March 17, 2012
Power Alley - Week 3

+7: Helena Handbasket
+5: Spanish Harlem Pinata Beaters
+4: Indiana Black Sox
-4: Sparta Hoplites
-7: New Orleans Thrill
-11: Leesburg Snow
Friday, March 16, 2012
Standings Summary - Week 3

This week we review the National League...
The trading frenzy of last week forces us to begin with Joe T's Helena Handbasket. This is a good thing, as Helena also owns the best overall record in Week 3 regardless of League, in part because of the trade for Walter Johnson. The big right hander was undefeated in 3 starts, completing two games on his own and striking out 17 against just 6 walks. In 27 1/3 innings he yielded just 19 hits and 5 runs (1.65 ERA). His presence seemed to have sparked the whole rotation as Helena hurlers combined for Week 3 team ERA of 2.66 and WHIP of 1.25
While the rest of the division slid back, division rivals Rusty Kuntz almost kept the pace with a good 9-6 week of their own, The Traveling All Stars were led by Ben Sheets and Al Orth who combined for a 1.88 ERA in 48 innings.
In the NL East, 4 teams are within a game and a half of a playoff birth with the Banana Bears surging to take the division lead thanks to a 9-5 record. An incredible offense was their own key to success - as a team they hit 24 homer runs and scored an incredible 86 runs, over 6 runs per game. Player of the week hopeful Ken Griffey Jr batted .471 / .481 / .941, slammed 7 out of the park, and drove in 21.
Winning 8 of 14, the Ee-Yah Orators were also solid as flamboyant catcher King Kelly caught fire batting .426 in 47 at bats. The timing was perfect as their rotation was awful, especially Larry Dierker who went 0-3 with an 11.09 RCERA.
Players of The Week

Thursday, March 15, 2012
Around the Horn
Musing from around the league
- The Orators are dead last in ATB in 1st innings runs scored at 13; they are tops in ATB in 9th inning runs scored with 28
- The "Mechanics" have been shut out an ATB leading 8 times while the Gossamers, Orators, Thrill, and World Police have scored at least 1 run in every game
- Dogphin29 managed to get a hit in 14 straight innings between May 8th and 9th. They also own the league best feat of scoring in 6 consecutive innings during that same stretch.
- Speaking of meaningless stats, the Fishbiscuits have a team OPS of .879 when it's hotter than 84 degrees; the "Mechanics" team OPS is just .532 at this temperature or higher.
- This is insanity. Check out the score sheet for the 4th inning, Chips at the plate.
- Joe Kelley leads the league with 1.071 OPS while pinch hitting (6-15, HR)
- Over the past month, Dan Brouthers (Thrill) leads the league in RC (.368 / .444 / .570 )
- Over the past month, Cy Blanton (Tommyknockers) is 8-1 with a 1.41 ERA
- Finally, a chart:
Average Innings by Starters
Team IP/G Games
Gossamers 6.8 42
Carnies 6.6 43
The Game 6.6 14
Shadows 6.4 40
Hoplites 6.4 40
White Rats 6.3 40
Banana Bears 6.3 42
Fishbiscuits 6.2 42
Chips 6.2 40
Black Sox 6.1 27
29 6.1 40
Handbasket 5.9 43
Travel All Star 5.9 42
"Mechanics" 5.7 42
Snow 5.7 39
Tommyknockers 5.7 43
Pinata Beaters 5.7 43
Orators 5.7 41
Red Lectroids 5.6 40
Slammers 5.5 42
Thrill 5.4 42
World Police 5.4 43
Brews 5.3 41
Daffiness Boys 5.3 40
Fanclub 4.8 41

Preventing Stolen Bases
Team Catcher's Opponents' Stolen Base % for Each Team
Team SB CS SB% G
Chips 33 6 84.6 40
Banana Bears 52 18 74.3 42
Snow 59 23 72.0 39
Thrill 46 18 71.9 42
Handbasket 51 20 71.8 43
Orators 48 19 71.6 41
Black Sox 26 11 70.3 27
Pinata Beaters 37 16 69.8 43
World Police 34 15 69.4 43
Hoplites 29 14 67.4 40
Tommyknockers 46 23 66.7 43
Fanclub 54 29 65.1 41
Red Lectroids 26 14 65.0 40
Shadows 39 21 65.0 40
Carnies 34 19 64.2 43
Gossamers 23 13 63.9 42
Fishbiscuits 40 23 63.5 42
29 50 29 63.3 40
Brews 41 24 63.1 41
Daffiness Boys 41 26 61.2 40
White Rats 41 27 60.3 40
Slammers 27 18 60.0 42
Travel All Star 27 21 56.3 42
"Mechanics" 20 27 42.6 42


Wednesday, March 14, 2012
RSAA Update
League Average ERA's
4.07 - Starters
3.77 - Relievers
Top 10 by Position
Starters
-16.3: Blanton,Cy 1935 - 1.71 RCERA (HT)
-13.3: Reuss,Jerry 1980 - 1.77 RCERA (BIC)
-12.7: Maddux,Greg 1995 - 2.39 RCERA (SWR)
-11.5: Brecheen,Harry 1948 - 2.26 RCERA (NPB)
-11.2: Gooden,Dwight 1985 - 1.97 RCERA ( )
-9.8: Mathewson,Christy 1908 - 2.27 RCERA (D29)
-9.6: Lowe,Derek 2002 - 2.44 RCERA (IBS)
-9.3: Koufax,Sandy 1965 - 2.32 RCERA (SS)
-9.2: Wyatt,Whit 1941 - 2.56 RCERA (HT)
-9: Haren,Danny 2009 - 2.23 RCERA (BIC)
Closers
-8.3: Berry,Joe 1944 - 1.81 RCERA (HH)
-7.1: Abernathy,Ted 1967 - 1.95 RCERA (DB)
-6.7: Neale,Joe 1890 - 2.5 RCERA (NOT)
-5.8: Hall,Dick 1964 - 2.02 RCERA (JMF)
-5: House,Tom 1974 - 2.05 RCERA (D29)
-4.7: Hiller,John 1973 - 2.14 RCERA (WPM)
-4.4: Jones,Doug 1997 - 1.79 RCERA (PRL)
-4: Garber,Gene 1978 - 2.63 RCERA (BS)
-3.7: Fultz,Aaron 2005 - 2.11 RCERA (SH)
-3.6: Murray,Dale 1974 - 2.53 RCERA (WPM)
Relievers
-6.8: Meredith,Cla 2006 - 0.37 RCERA (SPB)
-6.5: Ryan,B.J. 2006 - 1.36 RCERA (GCG)
-5.5: White,Gabe 2000 - 2.21 RCERA (DCC)
-5.4: Eckersley,Dennis 1990 - 2.3 RCERA (DCC)
-4.5: Wagner,Billy 1999 - 1.65 RCERA (PRL)
-3.8: Soria,Joakim 2008 - 0.66 RCERA (WPM)
-2.9: Rivera,Mariano 2008 - 2.53 RCERA (NOT)
-2.8: Dotel,Octavio 2002 - 2.19 RCERA (TWP)
-2.8: Tekulve,Kent 1983 - 1.68 RCERA (OFB)
Subscribe to:
Posts (Atom)