Thursday, September 20, 2012

Negro League Overview - Shortstops


This is an ongoing multi-part series on the new ATB Negro Leaguers that will be available in our next draft.  See here for the other parts.


Across the other infield positions we reviewed to date, the Negro Leaguers have projected to provide only middling to weak value come draft day.  However, at shortstop and ultimately in the outfield positions, ATB will benefit from several new elite players.

Willie “El Diablo” Wells was the first true power hitting shortstop in American Baseball history.  Before Alex Rodriguez, Ernie Banks, Rico Petrocelli, and Vern Stephens, shortstops didn’t hit 35, let alone 40 home runs.

Here is a list of the most single season home runs by a shortstop:

57 – 2002, Alex Rodriguez
52 – 2001, Alex Rodriguez
47 – 1958, Ernie Banks
47 – 2003, Alex Rodriguez
45 – 1959, Ernie Banks
44 – 1955, Ernie Banks
43 – 1957, Ernie Banks (played 3B too)
42 – 1999, Alex Rodriguez
42 – 1998, Alex Rodriguez
41 – 1960, Ernie Banks
41 – 2000, Alex Rodriguez
40 – 1969, Rico Petrocelli

Obviously, Rodriguez and Banks corner the market on power hitting shortstops.  However, it is not widely known that Wells featured similar power back in the late 1920’s.  In 1927/1928 he drilled 39 home runs and then upped that to 42 a year later.  In that 1928/1929 season he also hit 41 doubles and scored 157 runs, all while performing as one of the best fielding shortstop in Negro League history.

In the 500-resims, the 1928/1929 Wells batted .258 / .328 / .515 with 37 home runs and 36 doubles.  His .843 OPS is over 30 points better than Honus Wagner.  The 1929/1930 Wells was better still, batting .277 / .351 / .490 with 31 home runs and again 36 doubles.  His OPS was two points worse this year, but the increased batting average and walk rate improved his OBP by 23 points.  Quite simply, Wells is now the best shortstop in the game, easily a first round draft pick, and perhaps an overall Top 10 selection as well.

Wells isn’t the only starting caliber shortstop either.  George Carr, reincarnated Pop Lloyd, and Dobie Moore all project to receive 500 or more at bats next season.  Carr hit 18 home runs and 32 doubles for a .724 OPS, but will be hindered by a lackluster .298 on base percentage.  “Tank” played from 1920 through 1928; his top year was 1925 when he batted .365 / .420 / .631 in 293 at bats.

Elsewhere, Pop Lloyd received a facelift.  ATB has historically used a somewhat fictional stat line for Lloyd, borrowed from another Diamond Mind Baseball league several years ago.  Now that verifiable stats for Lloyd have been compiled, I’ve made the changes and we’ll use this new data going forward.  In our last batch of resims, affectionately known as the “79 resims”, Lloyd batted .292 / .367 / .365.  In these 500 resims Lloyd took a hit, and his new baseline is .296 / .334 / .367.  This is still quite good, and I have him preliminarily ranked as the 11th best offensive shortstop.

Finally, Dobie More is now a viable position player as well.  Featuring more power than Lloyd, Dobie hit 40 doubles and 12 home runs in 1921/1922 en route to a .277 / .289 / .408 line.  I also tested his 1922/1923 season and the results were similar:  .279 / .306 / .386.

Lloyd's best comp is 1923 Joe Sewell while Dobie looks eerily similar to 1982 Robin Yount.


Wednesday, September 19, 2012

Negro League Overview - First Base


This is an ongoing multi-part series on the new ATB Negro Leaguers that will be available in our next draft.  See here for the other parts.


Four first basemen looked good enough on paper to give them a look within the 500 resims.  Clarence Smith (1922) and Willie Bobo (1924) don't appear to bring enough offense to warrant any real interest on draft day, though Bobo is at least good enough to pinch hit (.250 / .319 / .374).

That leaves two viable second tier options in Ben Taylor and Edgar Wesley.  Taylor enjoyed a long career from 1914 through 1929, bouncing around both the Negro Major and Negro Independent leagues.  He was at his best earlier in his career, and his rookie and sophomore campaigns of 1914-1915 were used for ATB purposes.  He's a speedster, averaging 44 stolen bases against just 15 caught steals during the resims.  His batting average and on base percentage is well above the league average, though not particularly stellar for a power position.  He did average 46 doubles and 11 triples a season and I roughly rank him as the 14th best first basemen.  His line: .274 / .349 / .447 with 7 home runs and a .797 OPS.  His closest comp is Bill Terry, not too shabby.

Taylor was elected to the Baseball Hall of Fame in 2006; he batted over .300 in 15 of his first 16 years in baseball.

Wesley on the other hand is more of a traditional, power hitting first basemen.  Comparatively little is known about Wesley.  After brief stints in the Independent league, Wesley moved to the Majors at 29 years of age.  His best years for ATB purposes were 1925-1926, his age 34/35 seasons in real life, where he recorded an OPS over 1.000 and hit 33 home runs in 497 at bats.  In the preceding combination seasons of 1924/1925 and 1923/1924, Wesley also recorded OPS scores between .930 and .950.

The underrated fielder (in real life anyway, for ATB he is almost perfectly average) brings more power than Taylor, but it comes at a cost of 15-20 points in on base percentage.

His final resim line: .269 / .332 / .465 with 26 home runs and 17 doubles.  He's akin to Dick Allen (1972) with a bit higher batting average.  I rate him as the 16th best first basemen in ATB.


Tuesday, September 18, 2012

Negro League Overview - Third Base

This is an ongoing multi-part series on the new ATB Negro Leaguers that will be available in our next draft.  See here for the other parts.


Third base has been a notoriously difficult position to find quality ATB players and the addition of the Negro Leagues has done very little to change that.  Please understand, there have been plenty of historically great major league third basemen, but hardly any translate well to Diamond Mind Baseball and ATB.  In the resims, just 5 averaged an OPS over .800, only slightly better than second basemen (4) and shortstops (2).  Conversely, 8 left fielders, 10 center fielders, 12 right fielders, and 13 first basemen recorded an OPS at least as good.

At the hot corner, Judy Johnson was the best of Negro Leaguers.  Elected to the Baseball Hall of Fame in 1975, Johnson enjoyed a long career with a lifetime average well over .300.  He is credited with finding the great Josh Gibson and played on the famous Homestead Grays alongside Gibson, Satchel Paige, Cool Papa Bell, and Oscar Charleston.

For our purposes he rates as an excellent ranging back up infielder.  On paper Johnson showed promise, batting .362 / .399 / .541 with 41 doubles and 16 triples during the 1924-1925 seasons.  However, In over 230,000 resim at bats he hit just  .270 / .304 / .384.

Elsewhere, A.D. Creacy showed some pop, maintaining a .391 slugging in 16,000 at bats but his horrid .283 on-base percentage makes him basically unusable.  Newt Joseph also made the cut, but his .570 resim OPS precludes him from any interest on draft day.  In the table below you'll see few other options but I do wonder how the .390 OBP for Dave Malarcher will translate.


Monday, September 17, 2012

Negro League Overview - Second Basemen

This is an ongoing multi-part series on the new ATB Negro Leaguers that will be available in our next draft.  See here for the other parts.

Click to Enlarge

Within our new Negro league player set, two second basemen stand out above the rest – Walter Cannady and Newt Allen.  Neither however, will become household names in ATB as their generally lackluster stats coupled with the fact the computer AI used them in platoon situations, will make owners hesitant to spend any earlier round picks on the infielders.

“Rev” Cannady was a bit of an enigma.  A good hitter during his peak, Cannady was usually placed in the heart of a lineup and although he only played full time for 8 seasons he made the most of them, batting over .300 six times and in 1923 he batted .398 with a 1.071 OPS.  However, he was also mean and surly, and was often left alone.  He even attacked an umpire during a game, and on another occasion, upset with a call, bashed in an umpire’s car windows on the way out of the clubhouse.

In 1924 his OPS dropped to .838 and the combination of these two years is what was entered into DMB.  The .500 resims results were decent enough - .266 / .318 / .390 over the course of 35,000 at bats, just 91 per season.  In terms of OPS, Cannady ranks 12th overall in the resims.  A good comp for him is 1886 Hardy Richardson.

Behind Cannady is Newt Allen.  A famous slick fielding infielder for the Kansas City Monarchs, Allen played in 19 seasons between 1923 and 1944.  While never an elite hitter he was loved by his teammates and fans nonetheless.  In the resims he batted .257 / .306 / .346.  Couple that line with Vg/71 defense hey may get a look on draft day.  Those stats are very close to Jim Viox who was somewhat successful last season.

The last of the second basemen is Anderson Pryor.  His best stretch was 1924-1926 were he strung together OPS scores of .771, .837, and .668.  This isn't good enough for ATB and he'll end up undraftable (sub .600 OPS with Fr range).

Click to Enlarge


Saturday, September 15, 2012

Negro League Overview - Catchers


I’ve completed the latest batch of resims but haven’t quite figure out the best way to incorporate them into the fold of ATB V.  There comes a point where too much information is a bad thing, and we may reached that 3 years ago.  Adding another 500 resims sounded good to the little voice in my head, but much more difficult to make use of in practice.  How do I make them readable, do I update the player cards, or analyze each teams defense so all pitchers aren’t assumed to have played in a defensive neutral environment, etc.  Before posting hard data these issues need to be worked through and then put in to practice.  It will be weeks if not more before a full run down of the 500-resims are widely available.

However, I did want to tackle our new Negro League players.  By far the biggest addition to ATB in years, hundreds of negro league players are now available to be drafted.  Months ago I gave a brief rundown, but in the next few days (weeks?) I want to provide more data about this new player set.  One reminder, the negro league set is based upon a summation of two consecutive seasons of each player.  The Negro Major and Independent Leagues, along with the Cuban Leagues, didn’t play often enough to compile more than a few hundred at bats per season.  The solution was to simply add up two consecutive seasons and use that as the real life stats for DMB purposes.

I added the most likely negro leaguers to our ATB Source Database and included them in the 500-resims.  I am sure I missed some; this isn't meant to be an exhaustive list of who to draft.

Here are the results.  I’ll post articles on each position.

Click to Enlarge
One of the best and well known Negro Leaguer's of all time was Biz Mackey.  The strong armed backstop played 19 seasons, twice batting over .400, and came within 10 points of doing it a third time. At the time he played, Mackey was regarded by some as better all around player than Josh Gibson.  If not for his Ex arm however, Mackey would likely be a backup catcher in ATB. In the resims, the 25 year old batted .287 / .318 / .359 with 22 doubles and 4 home runs.  There are no great comps from our league, but he's akin to Joe Mauer (with a bit more pop and a bit less walks).  I have Mackey preliminarily rated as the 22nd best catcher overall, but that's likely too harsh.  Someone will draft him before 20 due to his great arm.

I chose the 1923-1924 combination for Mackey (real life .369 / .393 / .388) but he was great in 24/25 and 25/26 as well.  His raw stats are more prolific in the later years - .931 OPS in 25/26 - but the league as whole hit better too.  I believe that relative to his league he was at his best in 1923-1924 but I wouldn’t argue with anyone taking a chance on an alternate season.

The only other catcher selected was Pythias Russ and I suspect this will be the one and only mention on this blog.  The 23-year old looked decent on paper but his stats hardly translated.  He batted .268 / .289 / .338 in a platoon no less.  Similar to Mackey, he had better raw stats as a 24 year old and I wouldn't hold it against an owner to try out his .351 / .383 / .486 season.


Wednesday, September 12, 2012

Not Even the 100 Resims Tell the Whole Story


The 100 and 79 Resims changed drafting strategies forever.  This is nothing new, we learned this the hard way during our draft last spring.  A common complaint among owners, including myself, is that we often fell into what I called the "79 Resim Trap".  Those resims made many players looked better (or worse) than reality.

Perhaps the best example was Larry Doby.  Averaging 539 plate appearances across the 79 resims, Doby was the 6th best center fielder after scoring a .423 on base percentage and .799 OPS.  During the season he was a ruin, batting .258 with a .325 on base.  The after season 20 re-sim results where much the same:  .247 / .325 / .345.

Of course there are numerous plausible explanations for the difference.  Park factors for both Doby's home team and the league, general differences in quality of play in the 79 resims vs last season (due to 56 teams in the resims and 24 in ATB XIV), etc.  Each of these contribute to the difference in results of every player in the game.

However, part of my thinking always worried about the utter consistency in the 79 resim process.  With injuries turned off and the same schedule used repeatedly over and over, there are bound to be small but measurable differences in the results.  Pitchers especially, due to the fact they took the mound every 5 days against the same team, each season for 79 seasons.  Many pitchers wouldn't get to face all teams in the league with a schedule such as this.

Earlier this week, I mentioned my goal of conducting another batch of resims.  We have many new negro league players, a host of database corrections, and new ATB era to deal with (the era may end up changing things quite a bit).

For this new round of resims I decided to run at least 3 batches of 100 resims.  The difference in each batch is the team schedule, for which I'll shuffle so that they differ between each.  Random injuries will also be turned on so the rotations and lineups are not 100% predictable from one day to the next; over the course of 300 seasons the random variation from missing half of a season with a broken leg would be minimized.

Some early results are in and they are surprising.

  • Andrew Bailey tossed over 5000 innings in each batch (A and B, I haven't run C) and compiled a 2.87 ERA/1.21 WHIP the first time, and a 2.50 ERA/1.14 WHIP the second.


  • Noodles Hahn pitched in over 15,000 innings in each batch, and his stats went from 3.60/1.20 to 3.83/1.27


  • Walker Cooper saw his OPS drop from .700 to .664 over teh course 15,000 at bats in each batch


  • With at least 17,000 at bats in each batch, Gavy Cravath hit a respectable .261 / .313 / .444 in one batch, and an almost undraftable .250 / .303 / .420 in another

The schedule won't account for all of the variation.  100 seasons is a heck of a lot of data but I expect random variance would account for 1-2% difference, but I am confident that our previous resim iterations didn't give a clear view of each player and in fact, may had led some of us astray.

Monday, September 10, 2012

ATB Era Change

I've decided to tinker with the 'era' we use to simulate games in ATB.  Normally when we speak of era's, we mean the year in which the original batter or pitcher played.  For our purposes today, the era refers to the  ATB league itself.  I have the ability to adjust this era to make it play like the dead ball era, the homer happy late 1990's, or anything in between.

In the 79 resims batters collectively hit

9.39 hits per game
1.12 doubles
0.22 triples
0.75 home
3.32 walks

To put this in comparison, the 2012 AL hit:

8.72 hits per game
1.68 doubles
0.16 triples
1.11 home runs
3.02 walks

Those end up being striking differences.  The 79-resim batting average was over .270 while the AL hit just .256 last year.  Similarly, the AL on-base percentage was .320, but the 79-resim average was .335.  Home runs were (thankfully) suppressed, and the 79 resim slugging was .381 versus an AL average of .412.

I'll be making changes to the ATB era to bring them more in line with current 2012 statistics.  I'll likely do a batch of published resims as well.


Thursday, August 30, 2012

Database Cleanup, the Wild Pitch, and the IBB

Each year I take some time to clean-up our database.  The past few years defense and basic stats have been checked against baseball-rerefence for accuracy and adjusted where necessary.

This year I am going through the same exercise, but for the first time including Information Only stats.  These are stats that are not strictly required to enter a player into the game, they include:
  • For Batters: R, RBI, SH
  • For Pitchers: W, L, Sv, G, GS, CG, ShO, R, GF
Here are the critical errors found this off season.  There were many more (hundreds) of corrections on the information only stats, and a handful of additional minor corrections to the required stats.  These were minor enough (AB here, one triple there, 1/3 of an inning, etc) that they will not have in impact on player valuation and I didn't list them out.

Major Batter Corrections
  • 1930 Goose Goslin (overall line)
  • 1947 Harry Walker (10 more doubles)
  • 1964 Ken Boyer (10 more homers)

Major Pitcher Corrections
  • 1959 Hoyt Wilhelm (10 more K's)
  • 1983 Kent Tekulve (100 fewer batters faced, this worries me, his Opp BA will skyrocket)
  • 1995 Jose Mesa (5 fewer HBP's)
  • 2008 Corey Wade (88 more batters faced)
  • 2009 Ted Lilly (10 more walks)
  • 2011 Antonio Bastardi (78 more batters faced)
Intentional Walks
Throughout league history I have completely ignored the IBB mainly because baseball-reference never included the stat on it's main player pages.  However, a few years ago they altered their page layout and made room for it, making it a lot easier for me during data entry.   Until now, I let DMB self-estimate the IBB based upon pitcher walk rate and era.  This will change going forward and I made retroactive updates to virtually every player.

This may impact certain relievers significantly.  Jim Brewer, for instance, walked 25 batters in 78 innings.  DMB estimated that 4 of those walks (16%) were intentional.  In truth, Brewer intentionally walked 11 batters (44%) and I expect this would have a measurable impact to how Brewer performs.  The impact should be fewer non intentional walks.

Major IBB Updates
  • +10 - 1986 Mark Eichhorn
  • +8 - 1972 Jim Brewer
  • +7 - 1963 Dick Radatz
  • +6 - 1983 Steve Howe, 1987 Dave Smith, 1966 Phil Regan, 2002 Chris Hammond, 1969 Fritz Peterson
  • +5 - 2008 Chad Bradford, 1984 Willie Hernandez
  • -5 - 1978 Ron Guidry, 1982 Mario Soto, 1999 Randy Johnson, 2009 Tim Lincecum, 1968 Denny McClain, 1971 Wilbur Wood, 1971 Tom Seaver, 1968 Dave McNally, 2005 Andy Pettitte
  • -6 - 1979 JR RIchard, 1997 Al Leiter, 1985 Sid Fernandez, 1991 Nolan Ryan, 2009 Felix Hernandez, 1972 Don Sutton, 2005 Chris Carpenter
  • -7 - 1961 Whitey Ford, 1971 Vida Blue, 1995 HideoNomo
  • -8 - 1965 Sam McDowell, 1987 Nolan Ryan, 1998 Kerry Wood, 2008 Tim Lincecum, 2007 Chris Young

Wild Pitch Changes
Wild Pitches have historical been one of the "Informational Only" stats in our league.  This upcoming year, however, I decided to implement the Wild Pitch rating system DMB employs:
This number indicates how often a pitcher throws a wild pitch when there are runners on base. The wild pitch rating tends to range from 0 to 60 with an average of 15. Use the formula:

  rating = (wild pitches * 1000) / (batters faced * .43)

For example, if a pitcher threw four wild pitches in a season in which he faced 1000 batters, his rating is 9. Why .43? Because about 43% percentage of batters faced occur with runners on base, though this number rises and falls over time and will vary for individual pitchers.
Using that formula, the worst offenders will be:

80 - 1996 Ruffin,Bruce
79 - 2006 Rodriguez,Francisco
77 - 2005 Turnbow,Derrick
76 - 1890 Neale,Joe
70 - 2011 Holland,Greg
68 - 1998 Hoffman,Trevor
66 - 1998 Gordon,Tom
64 - 2002 Eischen,Joey
63 - 2002 Romero,J.C.
62 - 1981 Ryan,Nolan
60 - 1986 Murphy,Rob
59 - 1993 Bedrosian,Steve
58 - 1885 Ramsey,Toad
58 - 1993 Ward,Duane
57 - 1995 Holmes,Darren
57 - 1995 Nomo,Hideo
56 - 1998 Brocail,Doug
54 - 1999 Rocker,John
53 - 1967 Niekro,Phil
52 - 1872 Spalding,Al
51 - 2011 Robertson,David
50 - 1989 Davis,Mark
50 - 1989 Russell,Jeff
48 - 2008 Rodriguez,Francisco
48 - 2006 Reyes,Dennys
47 - 1993 Wetteland,John
47 - 1995 Mesa,Jose
46 - 1881 Whitney,Jim
45 - 2000 Nen,Robb
45 - 2003 Guardado,Eddie
44 - 1992 Guzman,Juan
44 - 2006 Liriano,Francisco
44 - 2008 Buchholz,Taylor
43 - 2010 Feliz,Neftali
43 - 2009 Bailey,Andrew
43 - 1970 Richert,Pete
43 - 1965 Wilhelm,Hoyt
43 - 2008 Lincecum,Tim
42 - 1991 Fassero,Jeff
42 - 2010 Jimenez,Ubaldo
41 - 2011 Bastardo,Antonio
41 - 2004 Nathan,Joe
41 - 2007 Marmol,Carlos
41 - 2001 Fox,Chad
40 - 2009 Hernandez,Felix
40 - 2008 Marmol,Carlos
40 - 1972 Marshall,Mike
40 - 1977 Sutter,Bruce

While mostly relievers, there are a few great pitchers on that list nonetheless.  If I am interpreting the formula correctly, this means that Bruce Ruffin will throw 80 passed balls for every 1000 times he pitches WITH RUNNERS ON BASE.

I don't expect the need for draft strategy changes, we are talking wild pitches now occurring between .01% and .08% of the time with runners on base instead of virtually never.

Wednesday, August 22, 2012

Further Evidence the 2000s Stink for Hitters

(Not that we needed any more).

I added Mike Trout and Andrew McCutchen to the system and ran 3 sims.  This was using last years database in neutral parks.

Trout:  
.263 / .312 / .338, 10 HR

McCutchen:
.283 / .321 / .338, 10 HR

Investigating the DMB Era Bias

Not sure why I hadn’t thought of this before, but this morning it struck me that Diamond Mind Baseball must handle certain “era’s” better than others.  Further, it shouldn’t be difficult to identify those era’s and adjust our drafting strategies accordingly, at least in terms of which new players to take a chance on.

DMB generally regresses all players to some sort of theoretical average.  For instance, Babe Ruth doesn’t maintain his real life 1.378 OPS, he regresses towards a league average and ends up with a 1.000 OPS.  He is still the best batter in both Real Life and the world of DMB, it’s just that DMB accounts for a reduction in quality because Ruth is facing stiff competition every day. 

We do not know how DMB does this, and more importantly, we don’t know which stats DMB values over others or how those stats are compared to the league averages.  However, we hopefully can get an idea of which era’s give the DMB engine more fits than others.

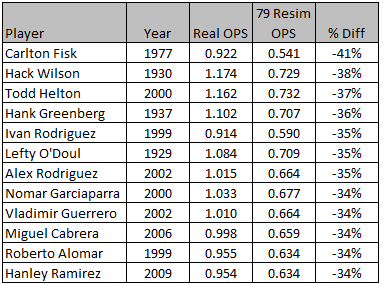
As it turns out, DMB is a harsh mistress.  Out of 499 qualified batting seasons, not one individual player saw their OPS improve from their real life average.  Overall, DMB reduces a player's OPS by an average of 25%

1884 Candy Nelson was impacted the least, with his OPS dropping just 2 percent from .682 to .665.  However, with a real life OPS that low he is a true oddity and not representative of the typical player drafted in ATB.  1884 Orator Shaffer was next on the list, is more of a typical player, and saw ‘only’ a 10% reduction in OPS (.900 down to .813). 

In third is 1876 Ross Barnes and a trend has emerged. The three players who hold up the best are all from the 1800s and incredibly, out of the top 20, only two were outside the dead ball era (pre 1919).

 
There is a similar trend at the opposite end of the spectrum, though not as pronounced.  While 1977 Carlton Fisk easily takes the biggest hit, with an OPS drop of 41% (.922 down to .541) and 1930 Hack Wilson is in second, with a 38% drop (1.174 down to .729), the current era players are at an extreme disadvantage.  Out of the 12 most impacted players, 9 are from 1999 or later.


 Below is a timeline for the batters, with the percent difference in OPS plotted against the player year.  The dots represent the actual average OPS difference for that year in particular, and the blue line is the 5-month rolling average trend.


The 1906-1917 sweet spot is obvious.  During this period batters averaged just an 18% dip in OPS, and that drops to 16% when excluding 1911 and 1912.  

Within this group there are some gems.  Three all time greats – Honus Wagner, Ty Cobb, and Tris Speaker – highlight this cast, but even as a whole this time period outperforms every other.  These outfielders averaged an 14.5% drop in OPS – stellar – but twenty others also saw OPS reductions of less than 20% and every single player in the study performed better than the -25% historical average.


I mentioned the two outlying years during this time frame, 1911 and 1912.  Nine players had enough at bats to qualify, collectively averaging a 23% drop in OPS.  To put that in perspective, a .900 OPS reduces to .756 with a 16% decline, and down to .693 with the 23% decline of 1911-1912.

 Here’s the exact numbers by year:
-16% - 1906
-15% - 1908
-13% - 1909
-19% - 1910
-22% - 1911
-23% - 1912
-19% - 1914
-18% - 1915
-14% - 1917

Excepting 1909, the trend in this 12 year period follows a normal distribution pattern, peaking in 1911 and 1912 with – Ty Cobb and Tris Speaker, among others such as Heinie Zimmerman, Sam Crawford, and Joe Jackson all appear in this two year period.  These are good players, but due to the specific yearly averages of the league, DMB treats them harshly.

The conclusion?  Take a flyer on some new players during this 1906-1917 period, but steer clear from 1910-1915, and specifically 1911 and 1912.

While there are a few other peaks, one other specifically needs to be mentioned. 

  • After a relatively lackluster 1930s, the war years 1943-1948 are generally kind to batters.  Phil Caverretta, Stan Spence, Stan Hack, Mickey Vernon, Dixie Walker, Stan Musial and more all had respectful declines in OPS.   1947 stands out as being particularly brutal, with Ralph Kiner and Johnny Mize combining to average a 30% decline in OPS.
  • The 1950s through mid 1980s are relatively stable with two minor exceptions. The late 1960s/Early 1970s has a noticeable drop thanks to Johnny Bench, Jim Wynn, Frank Howard, Rico Petrocelli, Harmon Killebrew and to a lesser extent Roberto Clemente.  The late 70s/early 80s are also periods to avoid, with Dwight Evans, Mike Schmidt, Gary Carter, Toby Harah, and Davey Lopes all struggling
  • Finally, it appears the worst period of all is our current era of the 2000s.  At first glance, I chalked this up to a selection bias.  We are collectively most familiar with players from our own era and naturally gravitate towards selecting them on draft day.  Indeed, a case can be made that players such as Edgar Renteria (-33%), Rich Aurilia (-32%), JD Drew (-32%), Jason Varitek (-30%) and others don’t belong in ATB to begin with.  However, true greats from our era also struggle:
-35%  - 2002 Alex Rodriguez
-34% - 2002 Vladimir Guerrero
-34% - 2006 Miguel Cabrera
-33% - 2007 Hanley Ramirez
-33% - 2007 Jimmy Rollins
-31% - 2006 Albert Pujols
-31% - Sammy Sosa

The list goes on and on.  In fact, only 6 of 70 players come in better than the historical ATB average of a 25% reduction of OPS.

What should we do with this information?  Frankly, the majority of us will completely disregard and that may not be the worst idea. I would not suggest that anyone avoids any player in particular because of this study.  However, if you are looking to take a flyer on two players that appear to be equal, take the one from the dead ball era and avoid the one from our current era.