
Recently, I have stumbled across a similar study that details the impact of error rates. It is included below as well.
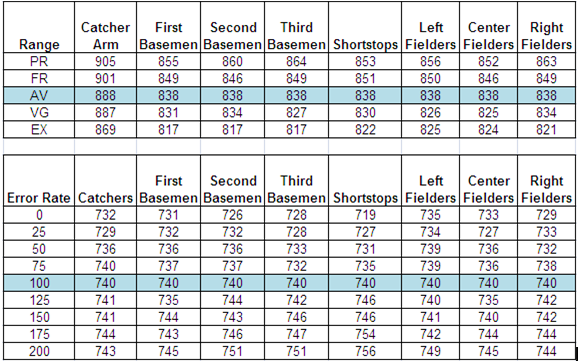 For those unfamiliar, the blue line represents the number of runs the average team yielded in each study. (Please note the studies were conducted by different people and you can see the ‘average” offense is different between each).
 As you move up and down the defensive abilities spectrum, the expected runs prevented changes with the defense. For instance, a team with a Pr rated first basemen gives up 17 more runs a season than a team with an average ranged first basemen (838 vs 855).
This new graphic below attempts to put both studies into perspective by changing runs scored to % above or below the average offense. It normalizes them:

Hopefully, it is obvious that teams focusing on great defense have a significant advantage in preventing runs. This isn’t an exact prediction, but if you had a team of Vg/75 defenders at every position, you could save your team about 65 runs per season (assuming the ATB XII average of 767 runs scored as the baseline).
Using some Bill James Pythagorean math, that changes an 81-81 team to a 88-74 squad. Drafting a team with good offense and defense, well, that is how one makes the playoffs.
No comments:
Post a Comment