A few random items I found interesting going through this study
- Is DMB biased towards one era vs another? Perhaps so. Here is the compiled slash stats for certain time periods - the 1800s, the early 1900s, etc. The 1960s and 1970s especially show a remarkable downturn in batting results. Of course, this study is not conclusive, just interesting. To do it right, I would need to sim all of the players from all of the era's and not just the players I personally think are best. One thing seems clear - when in doubt, choose the batters from the Ruth era.

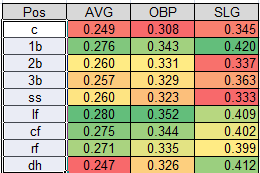
- As expected, first base and left field are the power positions while catcher and middle infielders are the weakest. I was surprised to see center fielders better than right fielders, but the difference isn't all that significant.

- I don't love the following chart, but I tried to depict the depth at each position. It is colored coded green to yellow to red based upon OPS, with blue reserved to the uber-elite. Hopefully it will be obvious that first base is very deep (lots of green) and shortstops are awful (lots of orange). The chart above reflects the average results for the entire player pool, while the one below is for just the starting players. Click on the chart for a larger view.

- Finally, I wanted to let everyone know I didn't mean to publish all of this data today. My apologies for the overload. Blogger allows me to publish with a future date, and the post appears automatically when the expected time is reached. That didn't work today, as most of these were to be 'live' next week.


No comments:
Post a Comment